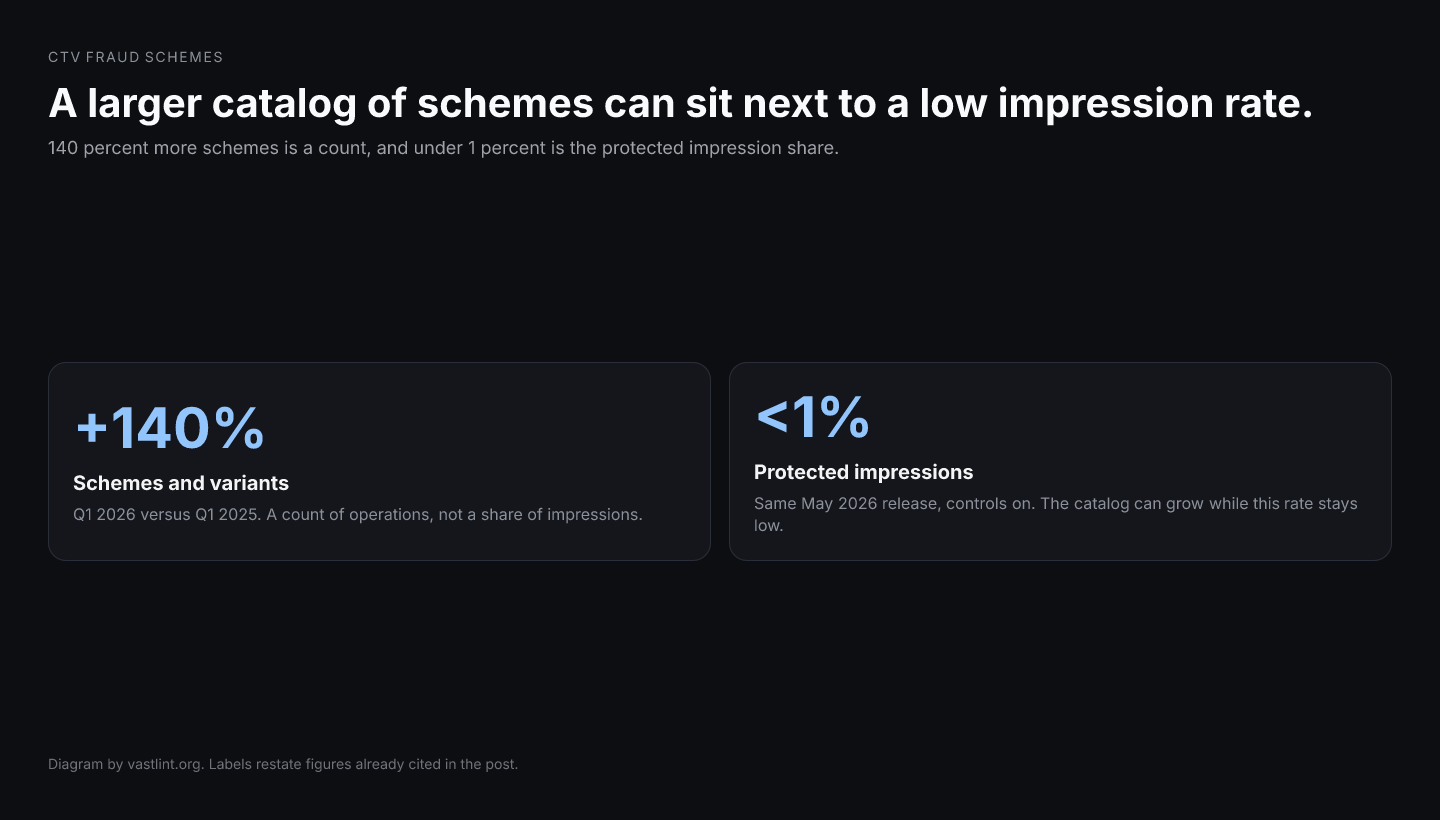
CTV fraud schemes is the search that starts from a headline. People also type CTV fraud up 140 percent, did CTV fraud increase, and how many fraudulent CTV apps there are. DoubleVerify's May 7, 2026 release says it detected 140 percent more CTV fraud schemes and variants in the first quarter of 2026 than in the first quarter of 2025. The same release says there were 10 times more fraudulent CTV apps than in 2024, and more than 50 bot attacks and variants in 2025. Each of those is a count of things the firm classified as operations or apps. None of them is a share of impressions.
The impression shares in that release go the other direction from the scary reading of 140. Protected campaigns, controls on, showed fraud under 1 percent. Unprotected tests showed nearly 9 percent. A year in which the catalog of schemes grows, and the share of impressions on campaigns with the control applied stays under 1 percent, is the release as written. Treating 140 percent as the impression rate deletes the unit and the protected cell.
vastlint does not count schemes. It checks the VAST 2.0–4.4 document a scheme would have to pass through, including whether verification survived the wrapper. A scheme count will not tell you that. A valid tag will not tell you the scheme count.
What a scheme is doing in the sentence
A scheme, in this release, is an operation: a way of extracting impressions, with variants as the operation changes. Counting them year over year measures how many such operations the firm says it distinguished. It does not measure how many impressions each one took. One scheme can be a handful of apps. Another can be the healthcare direct deal elsewhere in the release, where 34 percent of one campaign went to bots. The count goes up by one either way. That is why a scheme census and a campaign rate refuse to rank each other.
Variants make the count even less like a rate. A variant is a change inside an operation, and the release adds variants into the 140 percent. Splitting one operation into more detectable variants increases the count without a new pool of impressions. A detection team that gets better at naming variants can publish a higher scheme count in a quarter when the impression share is flat. The headline reads as more fraud. The method reads as a finer catalog.
Why the impression rates can stay quiet
The under-1-percent figure is conditional. It is DV-protected campaigns. If the control is doing what the study claims, new schemes are found and then kept off those campaigns, and the impression rate on the protected cell stays low while the catalog grows. That is not a contradiction. It is the control. The nearly 9 percent cell is where the controls were not applied. Quoting 140 percent and under 1 percent as if one refutes the other skips the condition.
Pixalate's 19 percent US CTV share, March 9, 2026, does not referee the scheme count either. It is an impression classification of a predominantly open-auction quarter. Pixalate did not, in that benchmark, publish a count of named schemes. A quarter can show 19 percent of impressions invalid and say nothing about whether the number of operations rose 140 percent. The two firms are not even required to be looking at the same log.
App counts are the same trap in a smaller frame. Ten times more fraudulent CTV apps than in 2024 is a count of apps. It is not ten times the IVT rate, and it is not Fire TV's 14 percent or Samsung's 28 percent. An app can be fraudulent and small. A device rate can move because the impression mix moved, with no change in the app census.
Counts in the May 2026 release that are not impression shares
- 140 percent more CTV fraud schemes and variants, Q1 2026 versus Q1 2025.
- 10 times more fraudulent CTV apps than in 2024.
- More than 50 bot attacks and variants in 2025.
- Impression share, same release, controls on: fraud under 1 percent.
- Impression share, controls off: fraud near 9 percent.
- Pixalate's 19 percent US CTV figure is an impression share from a different firm and a different log. It does not confirm or cancel the 140 percent.
A higher count of named schemes is a larger catalog, and the share of impressions on a protected campaign can stay low while the catalog grows.
Check the tag the scheme would have to pass through
Run VAST 2.0–4.4 tags against specification-derived rules so verification nodes and media files are present. Nothing is stored. This does not count fraud schemes.
Sources
DoubleVerify, May 7, 2026. Scheme counts, app counts, and the protected and unprotected impression rates.
The dollar in the same release, which is not this count.
Why the 140 percent does not rank a click multiple from another firm.