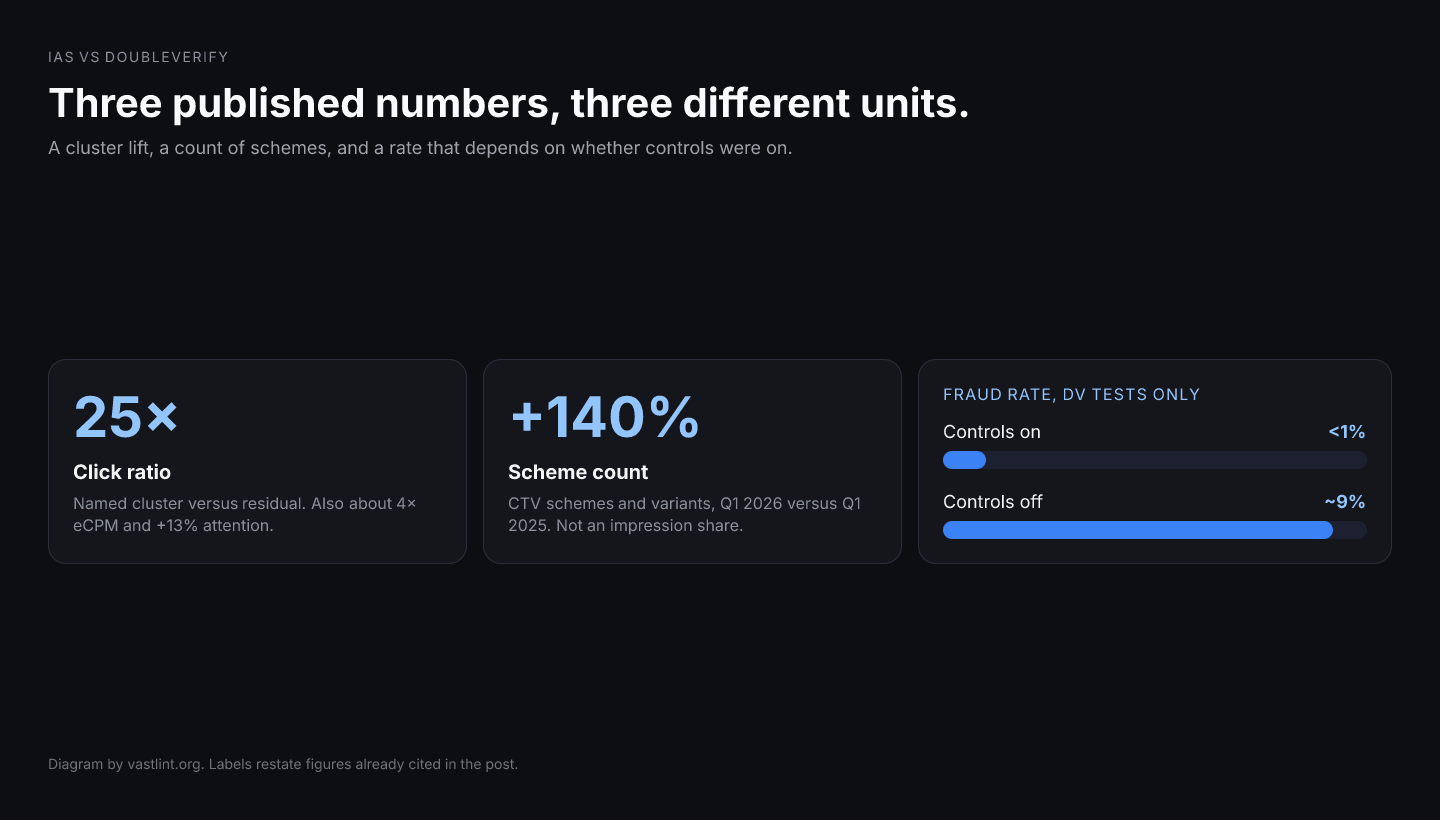
The search IAS vs DoubleVerify is a verification shortlist. The headlines that travel with the two names are not one measurement. On August 6, 2026, IAS Threat Lab described Papyrus, a mobile scheme in novel-reading apps: hidden webviews load other sites, taps on the reading interface are passed through as clicks, and pages scroll on remote instruction. In IAS analysis that cluster showed nearly 25 times the click success rate, roughly 4 times the eCPM, and about 13 percent higher attention scores than non-Papyrus traffic. On May 7, 2026, DoubleVerify released its CTV report, Must-CTV, and said it detected 140 percent more CTV fraud schemes and variants in the first quarter of 2026 than in the first quarter of 2025. The same release said fraud rates on DV-protected CTV campaigns were less than 1 percent, and nearly 9 percent where protection controls were not applied.
Three different objects are sitting in that paragraph. Papyrus is a lift on clicks, price, and attention for a cluster IAS had already separated from the rest of its observation. The 140 percent is a count of schemes and variants, year over year, not a share of impressions. The 1 percent and the 9 percent are impression fraud rates on two populations DoubleVerify defined by whether its own controls were on. A shortlist that puts 25 times next to 140 percent next to 9 percent has joined a ratio, a scheme census, and a rate.
Both companies sell media verification, and buyers compare them because both will say whether an impression should count. The public research does not settle the contract. Strip the company names off and the claim remains: a post-identification cluster study, a year-over-year count of schemes, and a protected-versus-unprotected impression rate do not order one another.
What the IAS figures measure
Papyrus is built for long reading sessions. The visible app is the novel. BootNova, the layer IAS names, takes remote instructions for which URLs load and how hidden webviews interact with those pages. IAS reports more than 800 domains and nearly 8,000 unique host values, skewed toward gaming, blog, news-style, and generative-AI destinations. The performance figures are Papyrus-associated supply compared with non-Papyrus traffic in IAS observation. IAS estimates close to $1 million a month in monetization impact at the peak, by applying an eCPM from supply it directly observed to a broader impression footprint from supply-path data.
IAS also says clients on IVT avoidance are already protected, because the associated apps, domains, and hostnames are filtered after identification. That is a block list with a date on it. It is a statement about supply IAS has named. A share of all mobile impressions in a quarter, a CTV rate, and another firm's label on the same apps are outside what this note contains.
The surface is mobile, and the unit is engagement and price for one named operation. The comparison group is whatever IAS left outside the Papyrus bucket. That residual is the traffic that was not placed in this cluster. It is not DoubleVerify's unprotected CTV test, and it is not an open-auction census of connected TV.
What the DoubleVerify figures measure
DoubleVerify's May 7, 2026 release describes the base in one sentence: proprietary measurement spanning billions of impressions from DV-protected campaigns, plus controlled tests where protection controls were not applied. Surveys of more than 2,000 marketers and 22,000 consumers in more than 20 markets sit in the same report and are a separate instrument. A survey of marketers is not an impression log. The fraud rates and the scheme counts come from the measurement data.
The 140 percent is schemes and variants, the first quarter of 2026 against the first quarter of 2025. DoubleVerify also says it uncovered more than 50 distinct CTV bot attacks and variants in 2025, and identified 10 times more fraudulent CTV apps in 2025 than in 2024. A scheme count can rise because detection got finer, because operators split one operation into more variants, or because more operations exist. The release does not decompose those causes. What the sentence reports is a count of schemes, not a claim that 140 percent more CTV impressions were invalid.
The impression rates are the other cut. On DV-protected CTV campaigns, fraud rates were less than 1 percent. On unprotected campaigns, nearly 9 percent. DoubleVerify estimates that fraud in unprotected campaigns can cost about $1.8 million per billion CTV impressions served, and calls that a conservative estimate. Those two rates are a with-and-without on DV's own controls. They are not the share of all CTV impressions in the open auction, and they are not the share inside private marketplace deals as a class.
The release also breaks the character of what it flagged. In North America, bot fraud made up 82 percent of violations, while data-center traffic dominated in APAC at 98 percent, EMEA at 66 percent, and LATAM at 91 percent. Direct buys were not treated as a clean room: in one consumer healthcare campaign bought direct, 34 percent of impressions went to bots, and in a major CPG campaign, also direct, 25 percent did. Twenty-one percent of advertisers measure CTV performance with IVT or fraud detection as a KPI. Each of those sentences has its own denominator: violations by region, a single campaign, a survey of advertisers.
Why the two headlines have no shared scale
The units do not match. Nearly 25 times the click success rate is a ratio of two engagement rates inside one firm's observation. One hundred forty percent more schemes is a count of operations. Less than 1 percent and nearly 9 percent are shares of impressions. There is no arithmetic that turns a click multiple on a mobile cluster into a CTV scheme count, or a scheme count into the fraud rate on a protected campaign.
The populations do not match. Papyrus ratios exist because IAS identified the scheme and split the log. DoubleVerify's under-1-percent figure exists because the campaigns in that cell had DV controls applied. The nearly-9-percent figure exists because a controlled test left those controls off. Quoting the 9 percent as the CTV fraud rate drops the condition in the sentence. Quoting the 1 percent as how much fraud is left in the market drops it the other way.
The surfaces do not match. Papyrus is mobile reading apps and hidden webviews. The DoubleVerify figures buyers paste into this shortlist are CTV. DoubleVerify's own regional split says the CTV violations are not one thing either: bots in North America, data-center traffic in APAC. A mobile webview cluster and a CTV scheme count are different devices on top of different units.
Get VAST spec updates, platform guides, and release notes in your inbox.
What to do with the shortlist
Write the unit next to the number before it enters a spreadsheet. Cluster lift, scheme count, protected impression rate, unprotected impression rate, single-campaign bot share. Those are separate columns. IAS versus DoubleVerify becomes a readable comparison after that split, and even then it is a comparison of published studies, not a test of whose filter would have saved one campaign.
If the question is a live line item, name the log. A campaign with a verification control on it is the protected population. A test that turns the control off is the other one. A named scheme found after the fact is a third. Movement between those states is a different incident from a new fraud variant.
Neither report checks the VAST document. A wrapper can drop AdVerifications and still fire an impression, and then both firms are labeling a creative the player may not have measured. vastlint is independent of IAS and of DoubleVerify. It checks structural consistency for VAST 2.0–4.4, including tracker URLs and verification placement. It does not detect invalid traffic, and it does not choose between these firms.
Questions worth writing down before the comparison
- Is the figure a click or eCPM ratio, a count of schemes, or a share of impressions?
- Was the log a named cluster, a protected campaign, or a test with controls off?
- Is the surface mobile webview or CTV, and which region's violation mix is being quoted?
- Is a single direct-deal campaign being treated as the market rate?
- Are AdVerifications still in the tag the player received?
A cluster lift, a scheme count, and a protected-campaign rate can all be accurate, and they still cannot rank the firms that published them.
Validate the tag the measurement is supposed to see
Run VAST 2.0–4.4 tags against specification-derived rules so verification companions and impression events are present and consistent. Nothing is stored.
Open the VAST validatorSources
IAS Threat Lab, August 6, 2026. Primary for the click, eCPM, attention, domain, host, and monthly impact figures.
DoubleVerify, May 7, 2026. Scheme counts, protected and unprotected CTV fraud rates, regional violation mix, and the direct-deal examples.
Why Papyrus and Pixalate's Q4 2025 IVT shares are a different comparison from this one.