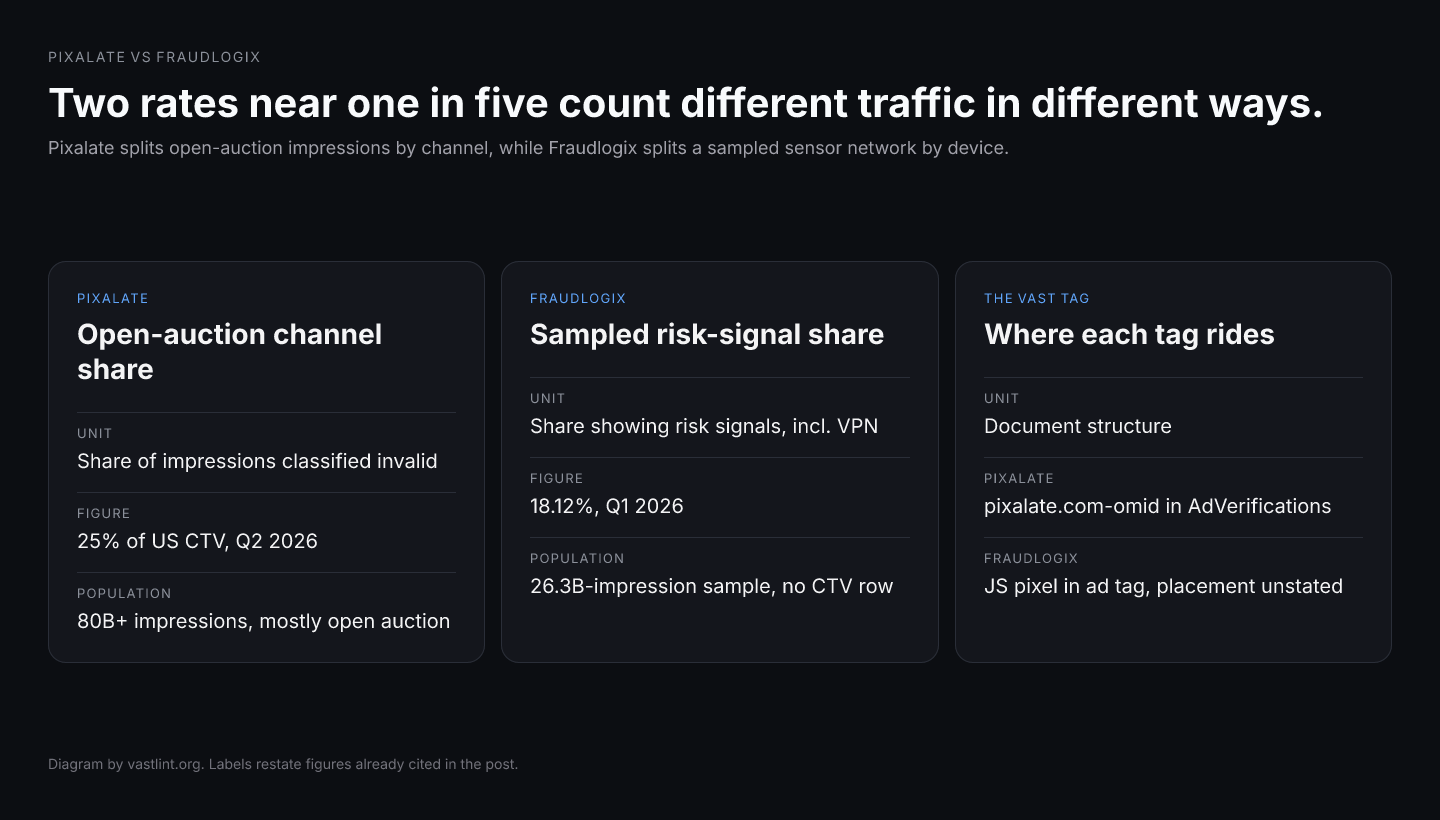
Pixalate vs Fraudlogix is the search a buyer runs after seeing two ad fraud rates that both round to about one in five. On August 12, 2026, Pixalate put Q2 2026 invalid traffic at 25 percent of US connected-TV impressions, 39 percent of US mobile app impressions, and 25 percent of US web impressions, from more than 80 billion global programmatic impressions that it describes as predominantly buy-side open auction. Fraudlogix's Q1 2026 report puts invalid traffic at 18.12 percent of a 26.3 billion impression sample collected from January 1 through March 31, 2026, and its State of Ad Fraud 2026 report puts full-year 2025 at 20.64 percent of 105.7 billion impressions. vastlint does not rank Pixalate against Fraudlogix. It checks whether a VAST 2.0–4.4 tag still carries the verification node and impression trackers that either firm's tag would need, and it does not classify invalid traffic.
The closeness of the numbers is the trap. The two rates come from different traffic, are cut along different axes, and use different definitions of invalid. Pixalate splits open-auction traffic by channel (web, mobile app, CTV). Fraudlogix splits by device form factor (desktop, mobile, tablet), publishes no CTV row, and counts traffic showing risk signals, including proxy and VPN detection and Tor exit nodes, as invalid. Pixalate reports under a Media Rating Council accreditation for sophisticated invalid traffic detection and filtration. A 25 beside an 18 is two firms describing two logs, not two readings of one market.
Both companies sell invalid traffic detection, both sell something that runs before the bid, and a platform can hire either one or both. The public reports do not say which hire would have caught more of a given campaign. Remove the company names and a quarterly open-auction channel share still does not order a sampled risk-signal rate.
What the Pixalate figures measure
Pixalate publishes a quarterly North America table, and the last three tables move. US CTV was 19 percent in Q4 2025 (released March 9, 2026, on more than 103 billion global impressions), 24 percent in Q1 2026 (April 29, 2026, more than 82 billion), and 25 percent in Q2 2026 (August 12, 2026, more than 80 billion). The Q2 2026 global rows are 20 percent for web, 41 percent for mobile app, and 26 percent for CTV. Each release says the datasets consist predominantly of buy-side open auction programmatic traffic sources, so the 25 percent is the share of US CTV impressions in that set which Pixalate classified as invalid in that quarter.
A second Pixalate cut uses a different base. The Q1 2026 CTV Ad Supply Chain Trends report, published May 25, 2026, says 25 percent of global CTV open programmatic ad traffic was invalid, from more than 19 billion open programmatic transactions across 210,000 CTV devices, and that Amazon Fire TV had the lowest rate among the measured platforms at 15 percent. The Q1 2026 benchmark prints the same 25 percent for global CTV while counting impressions, not transactions.
A third cut is a composition, not a rate. Pixalate's June 9, 2026 report on May 2026 CTV fraud types says proxy accounted for 57 percent of invalid traffic on Samsung Smart TV and 50 percent on LG Smart TV, while app spoofing led on Amazon Fire TV at 58 percent and Apple TV at 64 percent, from more than 2.5 billion open programmatic impressions across 4,000 CTV apps. The denominator there is the invalid traffic itself. Fifty-seven percent of Samsung's invalid traffic being proxy does not mean 57 percent of Samsung traffic was invalid, and it does not mean every proxy impression Pixalate saw was classified invalid.
The MRC's digital accreditation list shows Pixalate accredited for sophisticated invalid traffic detection and filtration across desktop, mobile web, mobile in-app, and CTV, and for SSAI video metrics across the same four. Pixalate's own metrics page says it does not currently report viewability metrics in CTV environments, and that invalid traffic designations in its products, including its pre-bid blocking lists, are its opinions rather than facts or guarantees. Accreditation is an audit of a method. It does not convert an open-auction share into the rate on a buyer's private marketplace deals.
What the Fraudlogix figures measure
The State of Ad Fraud 2026 report covers 105.7 billion impressions collected through Fraudlogix's sensor network from January 1 through December 31, 2025. Of those, 21.81 billion, or 20.64 percent, showed risk signals that Fraudlogix treats as invalid traffic. The report says the dataset was compiled specifically for this analysis and does not represent the entirety of traffic Fraudlogix monitored in that period. Device rows are desktop at 27.03 percent of 20.23 billion impressions, mobile at 19.30 percent of 80.53 billion, and tablet at 16.34 percent of 4.91 billion. The United States is 23.69 percent of 37.6 billion. The roughly $37 billion headline is arithmetic: an estimated $180 billion of 2025 US programmatic spend, attributed to an eMarketer forecast, multiplied by 20.64 percent. Fraudlogix's own note says the actual impact depends on verification practices, refund policies, and whether impressions were bought on a CPM, CPC, or CPA basis.
The Q1 2026 report covers 26.3 billion impressions from January 1 through March 31, 2026, across 246 countries and territories, with 4.77 billion flagged, an 18.12 percent rate. Desktop fell to 18.60 percent, mobile was 18.16 percent, and tablet 16.17 percent. The United States was 20.37 percent and 38.5 percent of the sample. Network rows include Amazon Web Services at 79.24 percent and Zscaler, which the report labels a security proxy or VPN, at 94.16 percent. The report calls the 26.3 billion a representative sample compiled specifically for this analysis that does not reflect the full volume of traffic observed. Fraudlogix's device-type page calls the Q1 set a subset of the 2025 annual dataset, although the two cover different years.
The definition is the larger difference. The annual report sorts traffic into two classes: valid traffic with no risk signals detected, and invalid traffic showing risk signals that indicate fraudulent or non-human activity. Its listed signals include proxy and VPN detection, Tor exit node identification, known botnet signatures, abnormal behavior, device spoofing indicators, and IP addresses with fraud histories. Fraudlogix's methodology page says more than 40 anomalies are weighted by type and severity, and its IVT product page says multiple indicators are required before traffic is flagged as high risk. The report does not split its rate into general and sophisticated invalid traffic. The MRC's June 2020 IVT addendum, which accredited vendors are audited against, treats invalid proxy traffic as sophisticated IVT when the proxy exists to manipulate counts or pass on invalid traffic, and it excludes routing artifacts of legitimate users from data-center GIVT. Fraudlogix's definition is its own, and a different definition is a different numerator.
Fraudlogix does not appear on the MRC's list of accredited digital services, and its report pages do not claim an accreditation; its own 2026 comparison page lists Pixalate as the choice for MRC-accredited measurement. The annual report says Fraudlogix is built for the sell side, naming SSPs, ad exchanges, DSPs, and enterprise publishers. The traffic behind the rate comes from its sensor network, a pixel that clients place in their ad creative or ad tag, from which a sample was drawn for the report. That population is not the predominantly buy-side open auction set Pixalate benchmarks.
Why two rates near one in five have no shared scale
The populations differ before either rate is computed. Pixalate's base is programmatic impressions it analyzed, mostly buy-side open auction, a quarter at a time. Fraudlogix's base is a sample drawn from its clients' pixel deployments and compiled for a report. A rate from a sell-side sensor footprint and a rate from buy-side open auction can both be accurate and still describe different inventory.
The axes differ too. Pixalate's rows are channels, and its US CTV row is the figure most people quote. Fraudlogix's rows are form factors, and its tablet and mobile rows have no CTV counterpart at all. Its mobile row is a device class rather than a channel, so it does not line up with Pixalate's mobile app row either. The tempting pairing in Q1 2026, Pixalate's global web at 20 percent beside Fraudlogix's 18.12 percent, sets a web-only channel share beside an all-device sample. The pairing that looks like a ranking, Pixalate's 25 percent US CTV beside Fraudlogix's 18.12 percent, compares a CTV row with a report that contains none.
The numerators differ in what counts as invalid. Both firms flag proxies: Pixalate's CTV fraud-type report puts proxy at the top of Samsung and LG invalid traffic, and Fraudlogix lists proxy and VPN detection among its risk signals and shows a VPN provider's network at 94.16 percent. The difference is the qualifier. MRC's standard reaches proxy traffic that exists to manipulate or pass on invalid traffic, and Fraudlogix's report describes risk signals without publishing how many impressions were flagged on proxy or VPN evidence alone. Neither firm publishes how many impressions would move between valid and invalid if that rule changed, which is the number a buyer would need to reconcile the two.
The dates and the dollars do not line up either. Fraudlogix's latest quarterly page is Q1 2026, Pixalate's is Q2 2026, and Pixalate's own US CTV figure moved six points in three quarters. Fraudlogix's $37 billion is a national spend estimate multiplied by a global sample rate. Pixalate's more than $6 billion in Q1 2026 global open programmatic CTV spend is a spend estimate inclusive of invalid traffic, not a loss figure, so the two dollar numbers are different calculations.
Which question each firm's number answers
Not published means the documents cited here do not contain the figure, not that the firm could not produce it for a client.
| Question a buyer asks | Pixalate public answer | Fraudlogix public answer |
|---|---|---|
| What share of US CTV impressions was invalid last quarter? | 25 percent in Q2 2026, in a predominantly buy-side open-auction set | Not published; the 2025 and Q1 2026 reports have no CTV row |
| What share of all impressions was invalid? | Not published as one number; Q2 2026 global rows are web 20, app 41, CTV 26 percent | 18.12 percent of a 26.3 billion sample in Q1 2026; 20.64 percent of 105.7 billion in 2025 |
| What kind of invalid traffic was it? | Type shares by CTV platform, such as proxy at 57 percent of Samsung IVT in May 2026 | Rates by network, browser, OS, and country; no GIVT and SIVT split in the reports |
| Is the method MRC accredited? | Yes, for SIVT detection and filtration across desktop, mobile web, in-app, and CTV | Not on the MRC accredited list, and the reports do not claim it |
| What runs before the bid? | Pre-bid blocking lists, which Pixalate calls opinions rather than guarantees | An IP blocklist of more than 30 million addresses, updated hourly, hosted on the client's servers |
| How does the tag ride in a VAST response? | JavaScript in AdVerifications as pixalate.com-omid, or a 1x1 pixel in Impression | A JavaScript pixel in the ad tag; no VAST placement or OMID vendor key in the pages read |
Where each firm's tag sits in the VAST response
Pixalate documents its video placement in detail. Its Video Viewability and Video Engagement page, in Beta and last updated June 2, 2026, says the JavaScript verification script must be referenced in the VAST AdVerifications node as a Verification with vendor="pixalate.com-omid" and a JavaScriptResource with apiFramework="omid", natively in VAST 4.x and inside an Extension of type AdVerifications in VAST 3.0. It says the measurement is not achievable in practice on VAST 2.0 and is not currently available on SSAI traffic, because stitched delivery does not carry client-side OM SDK signals. A separate page shows the Pixalate 1x1 tracking pixel placed in the VAST Impression element for custom integrations, and the viewability page warns that firing the 1x1 alongside the JavaScript tag on the same ad double counts impressions. Unexpanded macros make impressions Undetermined, and each of those conditions is visible in the delivered XML.
Fraudlogix's public pages describe a JavaScript pixel added to ad tags and a universal pixel placed in the ad creative or ad tag. The pages read for this comparison do not publish an OMID vendor key or say where the pixel belongs in a VAST document. The placement matters, because VAST treats the two common homes differently. An Impression element holds a URI that the player requests when the impression counts. A script runs only where the player loads an executable resource, such as an OMID JavaScriptResource inside a Verification. A buyer using Fraudlogix on video should ask for the exact placement and then confirm it in the document the player actually receives.
The spec side is narrower than either vendor's documentation. In VAST 4.1 and later, AdVerifications sits under InLine or Wrapper, each Verification names a vendor, and it carries a JavaScriptResource or ExecutableResource, optional VerificationParameters, and TrackingEvents where verificationNotExecuted reports a failed load through the [REASON] macro. IAB Tech Lab's OMID API document says VAST 2.0, 3.0, and 4.0 documents load the same AdVerifications schema inside an Extension with type AdVerifications. A wrapper hop or an SSAI stitcher that rebuilds the InLine can drop either form while the media still plays. Walled-garden placements such as YouTube, Meta, and TikTok are measured through platform integrations rather than a VAST tag the buyer supplies, so none of this XML exists there to inspect.
What to do with the shortlist
Label the denominator before a number enters a spreadsheet: an open-auction channel share for one quarter, a sampled risk-signal share, a composition of invalid traffic by type, or a dollar extrapolation. Pixalate vs Fraudlogix becomes four rows once the labels are written, and none of them is a score for the vendor. A buyer who picks the firm with the lower headline has picked a definition and a population, not a stricter filter.
If the comparison has to be real, run both on the same placements for the same weeks and compare by definition. Ask Pixalate for its Gross, Net, and Total Net tiers, noting that its metrics page labels the MRC's Total Net figure as Net. Ask Fraudlogix which signals flagged each impression, and how many impressions were flagged on proxy or VPN evidence without a second indicator. A platform cleaning its own supply and a buyer auditing open-auction CTV are asking different questions, and each firm's public report was written for one of them.
Before either firm can label a video impression, its tag has to survive the wrapper chain. vastlint is independent of Pixalate and of Fraudlogix. It checks VAST 2.0–4.4 structure, including Impression elements, AdVerifications placement, the vendor attribute, resource types, apiFramework, and the [REASON] macro on verificationNotExecuted. It does not classify invalid traffic, it does not know whether a vendor host is up, and it does not rank these firms.
What to separate before using this comparison
- Pixalate's 25 percent is a share of Q2 2026 US CTV impressions in a predominantly buy-side open-auction set of more than 80 billion global impressions.
- Fraudlogix's 18.12 percent is a share of a 26.3 billion impression sample from January to March 2026 that has no CTV row.
- Fraudlogix counts traffic with risk signals, including proxy and VPN detection and Tor exit nodes, as invalid, and does not split the rate into GIVT and SIVT.
- Pixalate's 57 percent proxy figure is a share of Samsung Smart TV invalid traffic, not a share of Samsung impressions.
- Fraudlogix's $37 billion is $180 billion of estimated US programmatic spend multiplied by 20.64 percent, not a measured loss.
- Pixalate's tag can sit in AdVerifications as pixalate.com-omid or in Impression as a 1x1, and firing both on one ad double counts.
Questions buyers ask about Pixalate and Fraudlogix
- Is Fraudlogix MRC accredited? Fraudlogix does not appear on the MRC's list of accredited digital services, and its reports do not claim an accreditation, while Pixalate is listed for SIVT detection and filtration across desktop, mobile web, in-app, and CTV.
- Why is Pixalate's rate higher than Fraudlogix's? The rates come from different populations and definitions: Pixalate's 25 percent is US CTV in mostly open auction for Q2 2026, and Fraudlogix's 18.12 percent is an all-device Q1 2026 sample with no CTV row.
- Does Fraudlogix publish a CTV ad fraud rate? Its 2025 annual and Q1 2026 reports break out desktop, mobile, and tablet only, although its marketing says its programmatic IVT detection covers CTV inventory.
- Does Pixalate count VPN and proxy traffic as invalid? Pixalate's May 2026 CTV report lists proxy as the leading invalid traffic type on Samsung Smart TV and LG Smart TV, and its accreditation is against an MRC standard that defines invalid proxy traffic as SIVT.
- Does Pixalate offer pre-bid blocking? Pixalate's own pages describe pre-bid blocking lists, although Fraudlogix's 2026 comparison page says it does not, so check the vendor's documentation rather than a competitor's table.
Check the tag before comparing the labels
Paste a VAST 2.0–4.4 tag to see whether AdVerifications, the vendor attribute, OMID resources, and Impression trackers are present and consistent. Nothing is stored.
Sources
August 12, 2026. US CTV 25 percent, US mobile app 39 percent, global CTV 26 percent, more than 80 billion impressions, predominantly buy-side open auction.
April 29, 2026. US CTV 24 percent, global web 20 percent, more than 82 billion impressions.
March 9, 2026. US CTV 19 percent and the more than 103 billion impression base.
May 25, 2026. Global open programmatic CTV IVT at 25 percent on more than 19 billion transactions, Fire TV at 15 percent, more than $6 billion in spend inclusive of IVT.
June 9, 2026. Proxy at 57 percent of Samsung Smart TV IVT and 50 percent of LG, on more than 2.5 billion impressions across 4,000 CTV apps.
Gross, Net, and Total Net labeling, no CTV viewability reporting, and the opinions disclaimer on pre-bid blocking lists.
AdVerifications placement as pixalate.com-omid, VAST version support, SSAI limitation, and the double-count warning.
The Pixalate 1x1 tracking pixel placed in the VAST Impression element.
20.64 percent of 105.7 billion impressions collected in 2025, device and country rows, the $37 billion calculation, and the risk-signal definition.
18.12 percent of a 26.3 billion impression sample, January to March 2026, with device, network, and country rows.
Mobile, desktop, and tablet impression counts and the description of the Q1 set as a subset of the annual dataset.
The 30 million IP blocklist, hourly updates, the JavaScript pixel, and the multiple-indicator rule.
Universal pixel in the ad creative or ad tag, and more than 40 weighted anomalies including proxy and data-center IP usage.
Fraudlogix's own comparison, listing Pixalate for MRC-accredited measurement and describing Fraudlogix as supply-side.
Updated January 8, 2026. Fraudlogix's claim of detection across display, video, native, and CTV inventory.
Pixalate's accredited metrics and environments; Fraudlogix is not listed.
June 2020. GIVT and SIVT definitions, including invalid proxy traffic and the legitimate-routing exclusion for data centers.
AdVerifications in VAST 4.1 and the Extension type AdVerifications path for VAST 2.0, 3.0, and 4.0.
What happens when one firm's CTV share is treated as the market norm.
The MRC split that Fraudlogix's two-class report does not use.
The envelope check for vendor, resource, and verificationNotExecuted before any measurement runs.