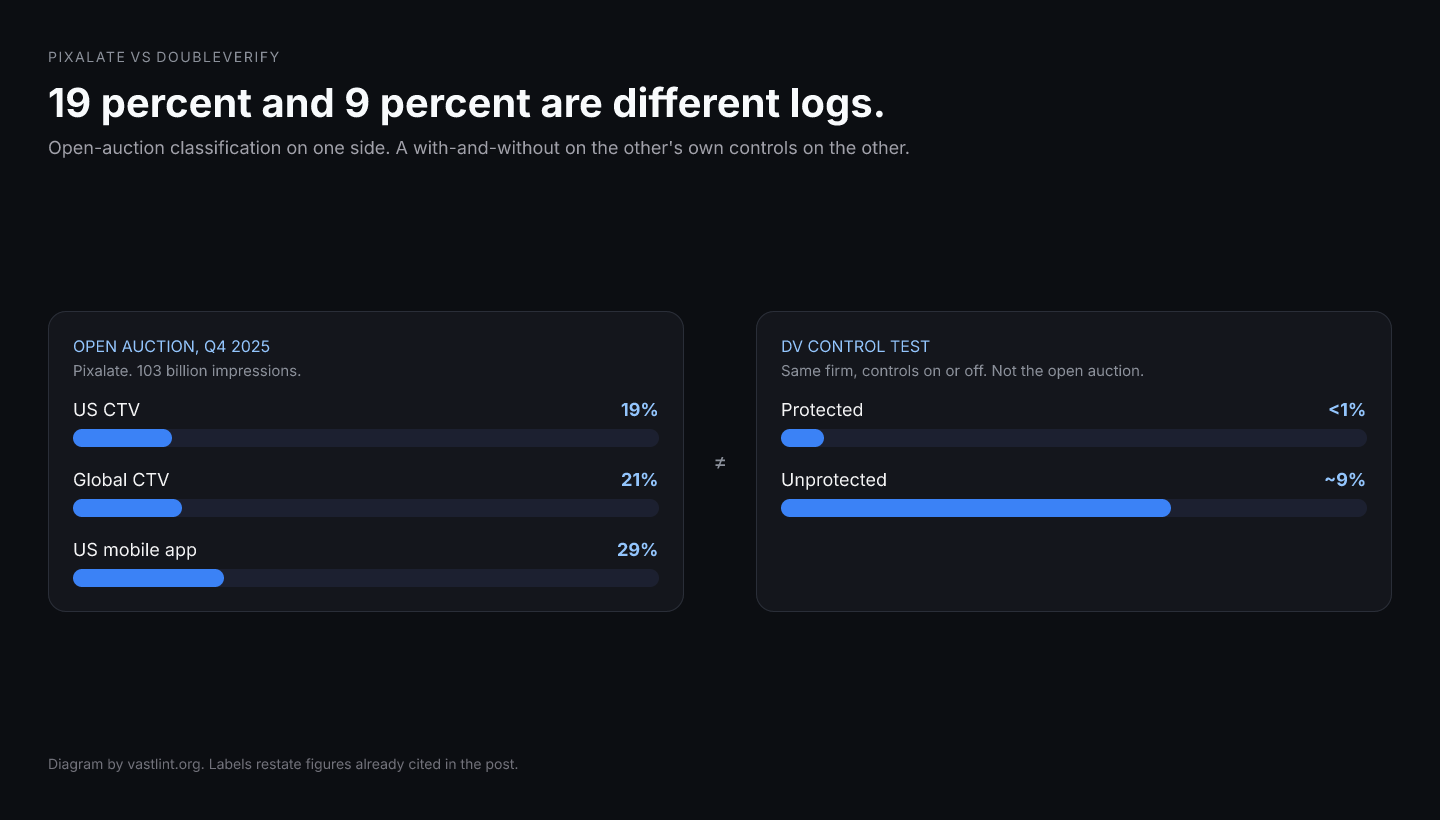
Pixalate vs DoubleVerify is the CTV shortlist. The numbers people paste side by side are 19 percent and something under 10 percent, and the paste treats them as rival readings of the same market. They are not. On March 9, 2026, Pixalate published Q4 2025 invalid-traffic benchmarks: 19 percent of US CTV impressions in its set, 21 percent of global CTV, from more than 103 billion programmatic impressions that are predominantly buy-side open auction. On May 7, 2026, DoubleVerify said fraud rates on DV-protected CTV campaigns were less than 1 percent, and nearly 9 percent in controlled tests where protection controls were not applied.
The gap between 19 and 9, or between 19 and 1, is the temptation. A lower rate looks like a cleaner market or a stricter filter. The sentences do not say that. One rate is the share of impressions a firm classified invalid inside a predominantly open-auction log. The other two rates are a with-and-without on a second firm's own controls. Ordering them ranks the footnotes, not the vendors.
Both firms sell CTV fraud detection, and a buyer can hire either one. The public tables do not say which hire would have blocked more of a given campaign. Remove the names and a quarterly open-auction share still does not compete with a protected-campaign rate.
What the Pixalate figures measure
The March 9, 2026 table is a set of invalid-traffic shares for the fourth quarter of 2025. United States: desktop and mobile web 25 percent, mobile app 29 percent, CTV 19 percent. Canada: web 20 percent, mobile app 27 percent, CTV 16 percent. Global: web 23 percent, mobile app 36 percent, CTV 21 percent. Pixalate says the data science team analyzed more than 103 billion global programmatic impressions, and that the datasets consist predominantly of buy-side open-auction traffic.
The 19 percent is the share of US CTV impressions in that set which Pixalate classified as invalid. Open auction is the source it names as predominant. A campaign bought as a private marketplace or as programmatic guaranteed sits outside the population that sentence describes. A log that already passed a pre-bid filter is a further cut. The benchmark is the classification rate on the traffic Pixalate analyzed.
A second Pixalate cut, published March 26, 2026, says 21 percent of global CTV open programmatic ad traffic was invalid, from more than 7 billion open programmatic transactions across 185,000 CTV devices, next to $6.9 billion in global open programmatic CTV ad spend. Seven billion CTV transactions and 103 billion impressions across web, app, and CTV are different bases, even where both writings print 21 percent for global CTV. Inside that supply-chain note, Amazon Fire TV is at 14 percent global device IVT and Samsung Smart TV is at 28 percent.
What the DoubleVerify figures measure
DoubleVerify's May 7 release is explicit about two CTV populations. Protected campaigns, with verification controls applied, showed fraud rates under 1 percent. Unprotected campaigns, controlled tests where those controls were not applied, showed nearly 9 percent. The measurement spans billions of impressions. The unprotected cell is not "all CTV." It is the cell where DV says the controls were off.
Other lines in the same release are easy to drop into the same cell and should not be. One hundred forty percent more CTV fraud schemes and variants, first quarter of 2026 versus first quarter of 2025, is a count of operations. More than 50 bot attacks and variants in 2025, and 10 times more fraudulent CTV apps than in 2024, are counts as well. About $1.8 million per billion impressions is an estimated cost on unprotected campaigns, not a rate.
Direct deals have their own rows. DoubleVerify says bot activity showed up in multiple direct CTV buys, including 34 percent of impressions in one consumer healthcare campaign and 25 percent in a major CPG campaign. Those are single campaigns, not the 9 percent and not the 19 percent. North America violations were 82 percent bot fraud. APAC violations were 98 percent data-center traffic. A national open-auction average and a single direct-deal bot share are different objects again.
Why 19 percent and 9 percent are not a ranking
The filters differ before the rate is computed. Pixalate's 19 percent is a classification of impressions that were in a predominantly open-auction set. DoubleVerify's under-1-percent figure is what remained after DV controls. Comparing a pre-filter market share with a post-filter campaign rate will make the post-filter number look smaller every time the control does anything. That gap is the control, not a verdict on which company sees more fraud.
The unprotected 9 percent is the closer neighbor, and it is still a different sample. It is a controlled test DoubleVerify ran with protection off, on the inventory that test included. Pixalate's 19 percent is a quarter of predominantly buy-side open auction across a stated impression base of more than 103 billion. Neither sentence says it measured the other's log. A test designed to show the effect of turning a control off is built to differ from a census-style benchmark of open auction.
Scheme growth can move the opposite direction from either rate. DoubleVerify can report 140 percent more schemes while protected campaigns stay under 1 percent, because a scheme count and an impression share are different units. Pixalate can report 19 percent of US CTV impressions invalid without having published a count of named schemes. A quarter in which schemes proliferate and the open-auction impression share stays flat is compatible with both releases. So is the reverse.
Device rows inside one Pixalate note make the same point without leaving the firm. Fire TV at 14 percent global IVT and Samsung Smart TV at 28 percent are both open-programmatic CTV in Q4 2025, and they differ by fourteen points because the device population changed. A shortlist that cannot tolerate that spread inside one report should not treat 19 percent and 9 percent, from two firms and two filters, as a ranking of the companies.
Get VAST spec updates, platform guides, and release notes in your inbox.
What to do with the shortlist
Label the cell before you quote it. Open-auction impression share, protected campaign, unprotected test, single direct deal, scheme count, device-level rate. Pixalate versus DoubleVerify is six comparisons if you keep the labels, and one false comparison if you do not.
If you buy mostly deals, the open-auction 19 percent is the wrong denominator for your own log, and the direct-deal examples in the DoubleVerify release are a warning that "direct" is not a fraud rate of zero. If you buy mostly open auction with a pre-bid filter on, your remaining IVT is a third number, closer to a protected rate than to either headline.
The tag is still a separate check. Server-side stitching can fire beacons without the device context a fraud model expects, and a wrapper can omit the verification node both firms want to see. vastlint is independent of Pixalate and of DoubleVerify. It checks VAST 2.0–4.4 structure, including MediaFiles, trackers, and verification placement. It does not classify invalid traffic.
Rates that do not belong in one column
- Pixalate, Q4 2025, US CTV, predominantly open auction: 19 percent of impressions.
- Pixalate, Q4 2025, global CTV, same benchmark release: 21 percent of impressions.
- DoubleVerify, DV-protected CTV campaigns: fraud under 1 percent.
- DoubleVerify, controls not applied: fraud near 9 percent.
- DoubleVerify, two named direct deals: 34 percent and 25 percent of impressions to bots.
- DoubleVerify, Q1 2026 versus Q1 2025: 140 percent more schemes and variants, which is not an impression share.
A lower fraud rate on a protected campaign and a higher rate on an open-auction benchmark are different logs, and the gap between them is not a winner.
Validate the tag before you trust either rate
Run VAST 2.0–4.4 tags against specification-derived rules so verification companions, media files, and impression events are present. Nothing is stored.
Open the VAST validatorSources
March 9, 2026. US CTV at 19 percent, global CTV at 21 percent, more than 103 billion impressions, predominantly buy-side open auction.
March 26, 2026. Global open programmatic CTV IVT at 21 percent on more than 7 billion transactions.
DoubleVerify, May 7, 2026. Protected and unprotected CTV fraud rates, scheme counts, and direct-deal examples.
The open-auction benchmark beside a named-scheme study, which is a third comparison.