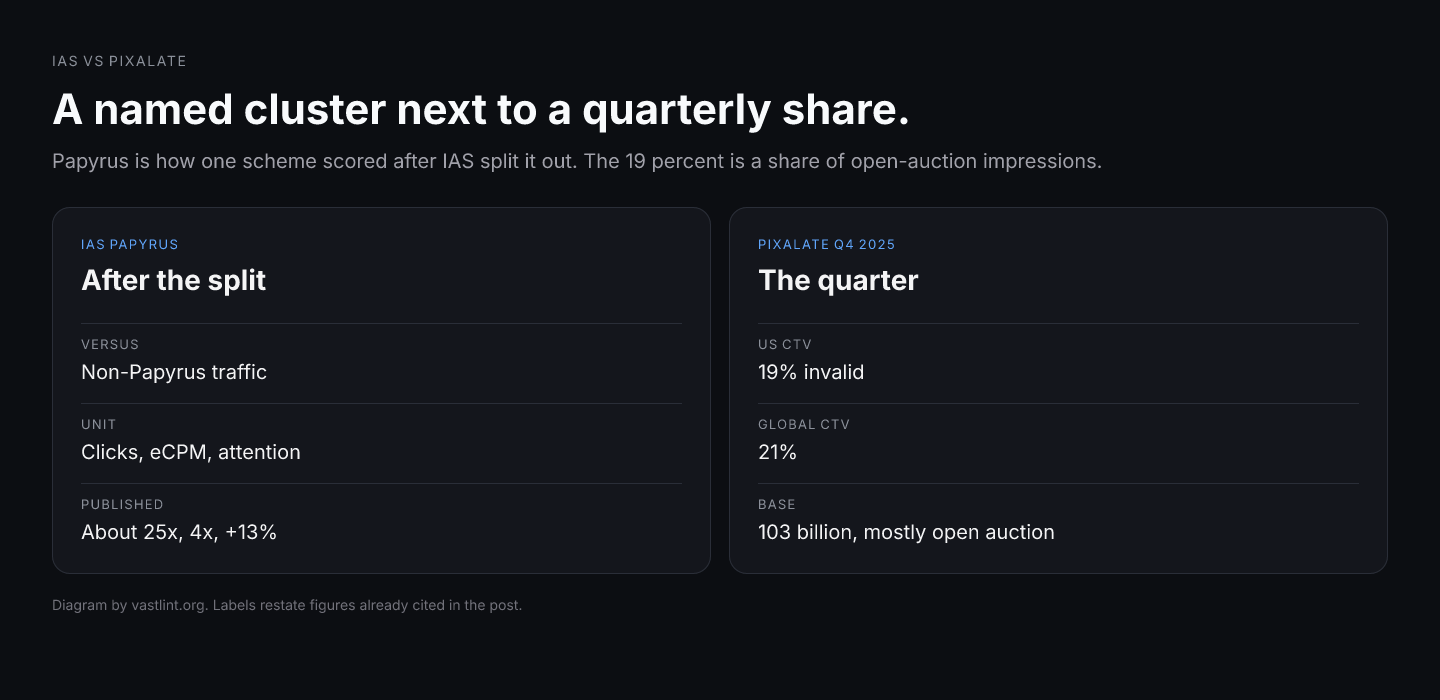
The query IAS vs Pixalate is a vendor shortlist. The two headlines that travel with those names are a named-scheme study and a quarterly impression share. On August 6, 2026, IAS Threat Lab described Papyrus: novel-reading apps that keep a reading interface on screen while hidden webviews load other sites, pass user taps through as clicks, and scroll pages on remote instruction. In IAS analysis that cluster showed nearly 25 times the click success rate, roughly 4 times the eCPM, and about 13 percent higher attention scores than non-Papyrus traffic. On March 9, 2026, Pixalate published Q4 2025 invalid-traffic benchmarks: 19 percent of US connected-TV impressions in its set, 21 percent of global CTV, drawn from more than 103 billion programmatic impressions that are predominantly buy-side open auction.
The denominator is the argument. Papyrus is how a cluster scored on clicks, price, and attention after IAS had already separated it from the rest of its observation. The Pixalate table is the share of impressions, in a quarterly open-auction set, that Pixalate classified as invalid. A click multiple on a named scheme is a result about that scheme, and a 19 percent invalid share is a result about that impression set. Adjacent cells in a shortlist do not turn those two results into a ranking of the traffic or of the firms.
Both companies sell detection and measurement. IAS describes IVT avoidance that filters the apps, domains, and hostnames once a scheme is identified. Pixalate describes fraud protection, privacy, and supply-chain analytics, and the benchmark release says Pixalate is accredited by the MRC for sophisticated invalid traffic detection and filtration. Hiring either firm is a contract, a coverage map, and a log you can actually join. The public research leaves that choice open, because the headlines answer different questions. Remove the company names and the claim still stands: a post-identification cluster study and a quarterly impression benchmark do not order each other.
What the IAS figures measure
Papyrus is a mobile operation built around long reading sessions. A utility app is open briefly, while a novel app stays in the foreground, and IAS treats that window as the time the scheme monetizes. BootNova, the orchestration layer IAS names, takes remote configuration for whether hidden activity runs, which URLs load, how many webviews are active, and how those webviews interact with the page. Workers IAS calls WebViewOut attach the webviews behind the visible interface through native layering. IAS reports more than 800 domains and nearly 8,000 unique host values, skewed toward gaming, blog, news-style, and generative-AI destinations.
The ratios, Papyrus-associated supply compared with non-Papyrus traffic in IAS observation, are nearly 25 times the click success rate, roughly 4 times the eCPM, and about 13 percent higher attention scores. IAS puts monetization impact near $1 million a month at the peak. The method IAS states takes an eCPM from Papyrus supply it directly observed and applies that eCPM to a broader impression footprint from supply-path data. The comparison group is the traffic IAS left outside the Papyrus bucket. IAS's prose also calls the gap a case of fraudulent traffic looking more valuable than legitimate traffic. The published statistic itself is the split between the named cluster and the residual.
IAS says clients on IVT avoidance are already protected, because the associated apps, domains, and hostnames are filtered as invalid across avoidance and measurement. That is a block list after identification. The document reports the cluster's lift on clicks, price, and attention, a domain count, a host count, and an estimated monthly monetization figure built from an observed eCPM and a broader impression footprint. A Q4 2025 share of all mobile impressions, a CTV rate, and another firm's label on the same apps are outside what this note contains.
What the Pixalate figures measure
The March 9, 2026 release is a table of invalid-traffic shares for Q4 2025. United States: desktop and mobile web 25 percent, mobile app 29 percent, CTV 19 percent. Canada: web 20 percent, mobile app 27 percent, CTV 16 percent. Global, in the same release: web 23 percent, mobile app 36 percent, CTV 21 percent. Pixalate says its data science team analyzed more than 103 billion global programmatic impressions, and that the datasets behind the insights consist predominantly of buy-side open-auction traffic.
The 19 percent is the share of US CTV impressions in that set which Pixalate classified as invalid. Open auction is the source Pixalate names as predominant. A campaign bought as private marketplace or programmatic guaranteed sits outside the population that sentence describes. A log that has already passed through a pre-bid IVT segment is a further cut: the benchmark is the classification rate on the traffic Pixalate analyzed, which is a different object from invalid traffic remaining after a buyer's own filter.
Pixalate published a second Q4 2025 cut on March 26. That CTV supply-chain note says 21 percent of global CTV open programmatic ad traffic was invalid, from more than 7 billion open programmatic transactions across 185,000 CTV devices, next to $6.9 billion in global open programmatic CTV ad spend. Inside that note, Amazon Fire TV is the low end of global device IVT at 14 percent and Samsung Smart TV is the high end at 28 percent. Seven billion CTV transactions and 103 billion impressions across web, app, and CTV are different bases. Both writings print a 21 percent global CTV figure. Matching headlines with different bases are two measurements that happen to share a number.
A third Pixalate cut is a spend map. MediaPost, on August 5, 2026, reported a June 2026 Pixalate study: large-screen devices account for 57 percent of US open programmatic CTV ad spending, and 43 percent runs on phones, tablets, and other small screens. The finding is a device split of spend, with no invalid-traffic rate attached. Across the three public Pixalate headlines, one is an impression classification, one is a CTV transaction classification, and one is a spend composition.
Why the two headlines have no shared scale
The units differ. IAS reports relative click success, eCPM, and an attention score for one scheme against other traffic in its observation. Pixalate reports the percent of impressions it classified invalid. There is no conversion from nearly 25 times the click success rate into 19 percent invalid traffic. A spreadsheet that places them in one ranking has joined two quantities that do not share a scale.
The moment of measurement differs. Papyrus ratios exist because IAS identified the scheme and split the log. The residual includes whatever was outside that cluster, including invalid traffic IAS had not placed in this bucket. Pixalate's quarterly share is a classification across the impressions it analyzed, rather than a before-and-after on one operation. A cluster can look expensive on engagement metrics and still be a small slice of impressions. A 19 percent rate can be the sum of many patterns that never receive a name.
The surface differs. Papyrus is mobile, in reading apps, with hidden webviews. The Pixalate number set next to it in a shortlist is usually the US CTV row at 19 percent. The closer row in Pixalate's own March 9 table is mobile app: 29 percent in the United States and 36 percent globally. That row is an impression share for open-auction app traffic in a quarter, which is a different statistic from a click ratio on novel-reading apps that run concealed browsers.
Get VAST spec updates, platform guides, and release notes in your inbox.
What to do with the shortlist
Ask for the population before a headline becomes a reason to hire. Which impressions are in the denominator: a named cluster, open auction, deals, or traffic that already passed a filter. Whether the figure is a block decision before the bid or a label after the impression. Whether the surface is a mobile webview, a mobile app, the web, or CTV. A firm can be the right operator for a campaign and still have published a number that answers a different question from the one on the shortlist.
Split the metrics on the campaign you already run. When click success or an attention score rises while viewability and completion stay flat, the pattern matches what Papyrus did to engagement, and the next question is whether those events were bound to the surface a person actually saw. When an IVT rate moves because the buy shifted from open auction into deals, the denominator moved: that incident is a mix shift, and a new named scheme is a different incident.
The VAST payload is a separate check from either report. A wrapper can drop AdVerifications, fire an impression, and leave a verification vendor with nothing on the creative the player rendered. vastlint is independent of IAS and of Pixalate. It checks structural consistency for VAST 2.0–4.4: required elements, tracker URLs, and verification placement. It does not detect invalid traffic, and it does not choose between these firms. The check tells you whether the tag can carry the measurement the shortlist is about to argue over.
Questions worth writing down before the comparison
- Denominator: named cluster, open auction, deals, or traffic already filtered.
- Timing: a block before the bid, or a label after the impression.
- Surface: mobile webview, mobile app, web, or CTV, matched to the row you are quoting.
- Unit: a ratio against residual traffic, or a share of impressions in a quarter.
- On a live line item, whether click or attention moved while viewability and completion stayed flat.
- Whether AdVerifications and impression events are still in the tag the player received.
A named cluster and a quarterly impression share can both be accurate, and they still cannot rank the firms that published them.
Validate the tag the measurement is supposed to see
Run VAST 2.0–4.4 tags against specification-derived rules so verification companions and impression events are present and consistent. Nothing is stored.
Open the VAST validatorSources
IAS Threat Lab, August 6, 2026. Primary for the click, eCPM, attention, domain, host, and monthly impact figures, and for the observed-eCPM method.
March 9, 2026. US, Canada, and global IVT shares, and the 103 billion impression, predominantly buy-side open-auction base.
March 26, 2026. Global open programmatic CTV IVT at 21 percent on more than 7 billion transactions, with device rates and $6.9 billion in spend.
MediaPost, August 5, 2026, on Pixalate's June 2026 US open programmatic CTV spend split: 57 percent large screen, 43 percent small screen.
The Papyrus mechanism, and which engagement signals move when the impression is synthetic.
The June 2026 spend split as a delivery problem for one VAST tag on two player regimes.
The same Papyrus figures beside DoubleVerify's scheme counts and protected-campaign rates.
The Q4 2025 benchmark beside DoubleVerify's protected and unprotected CTV rates.