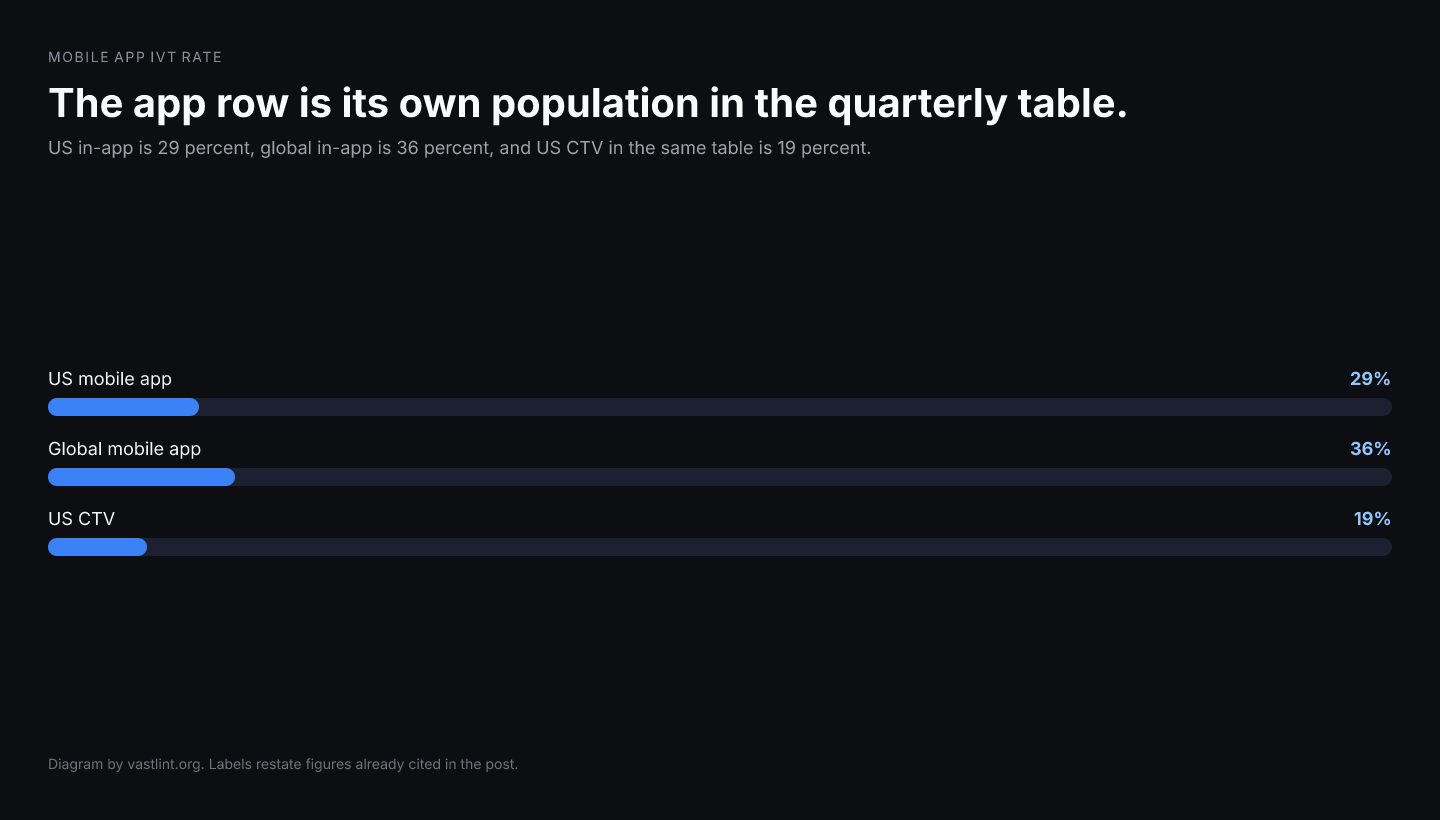
Mobile app IVT rate is the cell next to the CTV number people already quote. People also type in-app ad fraud rate, mobile invalid traffic benchmark, and whether app fraud is worse than CTV. Pixalate's March 9, 2026 table, for the fourth quarter of 2025, puts United States mobile app invalid traffic at 29 percent, global mobile app at 36 percent, and Canada mobile app at 27 percent. The same rows put US desktop and mobile web at 25 percent and US CTV at 19 percent. The base is more than 103 billion global programmatic impressions, predominantly buy-side open auction.
The app row is higher than the CTV row in that table, in the US and globally. That is a surface difference inside one method and one quarter. It is not a ranking of app fraud against connected TV as markets, and it is not IAS's Papyrus result. Papyrus, August 6, 2026, is a named cluster in novel-reading apps: nearly 25 times the click success rate, roughly 4 times the eCPM, about 13 percent higher attention, versus other traffic IAS had already separated. A click multiple on a cluster is not 29 percent of US in-app impressions.
vastlint does not publish an app IVT rate. In-app video still arrives as VAST. The check is whether that tag's media, trackers, and verification nodes are structurally present in versions 2.0–4.4.
What the 29 percent includes, and what it leaves out
It is the share of US mobile app impressions in Pixalate's set that the firm classified invalid. Open auction is the source it names as predominant. A campaign bought as a private marketplace, or a log that already passed a pre-bid filter, is not automatically inside that 29 percent. Global at 36 percent is the same kind of sentence on a wider geography, not a restatement of the US. Canada at 27 percent is a third geography. Using the global number for a US app buy, or the US number for a Canadian buy, is how a benchmark becomes a target for the wrong country.
Web is the neighboring row, 25 percent in the US and 23 percent globally, so the table is not an app-versus-everything story. Desktop and mobile web, mobile app, and CTV are three surfaces. The US app cell is four points above US web and ten points above US CTV. Those gaps are large enough to matter and small enough to vanish if you round the whole release to one fraud rate. The normal-rate note is what happens when the CTV cell is asked to stand for all three.
Why Papyrus is not the app benchmark
Papyrus is evidence that a mobile scheme can inflate clicks, price, and attention on real phones, with more than 800 domains and nearly 8,000 host values, and an estimated peak near $1 million a month. IAS says the associated apps and hostnames are then filtered for clients on IVT avoidance. That is a list after identification. The 29 percent is a classification of a quarterly impression set before you know whether any of those apps were in it. A buyer who treats Papyrus as the explanation of the 29 percent has assigned one cluster to a denominator the cluster study did not claim.
The two mobile facts can both be used. The quarterly share is the open-auction app baseline in that table. The cluster is a mechanism: hidden webviews, taps passed through as clicks. Mechanism plus baseline is not a sum. An app campaign that has already excluded the Papyrus list is no longer the unfiltered quarterly set, and its remaining IVT is a third number.
App cells that are not the CTV cell and not Papyrus
- Pixalate, Q4 2025, US mobile app, March 9, 2026: 29 percent of impressions invalid.
- Same release, global mobile app: 36 percent. Canada mobile app: 27 percent.
- Same release, US web: 25 percent. US CTV: 19 percent. Three surfaces.
- Base: more than 103 billion impressions, predominantly buy-side open auction.
- IAS Papyrus, August 6, 2026: nearly 25 times the clicks on a named cluster, which is not 29 percent of US in-app impressions.
The app row in the quarterly table is a surface, the cluster study is one operation on phones, and a CTV rate will not stand in for either.
Check the in-app VAST tag the rate never opens
Run VAST 2.0–4.4 tags against specification-derived rules so media files and verification nodes are present. Nothing is stored. This does not classify in-app traffic.
Sources
March 9, 2026. US mobile app at 29 percent, global mobile app at 36 percent, US CTV at 19 percent.
IAS Threat Lab, August 6, 2026. A named cluster, not the quarterly app share.
The CTV cell from the same table, which this note does not let stand for apps.