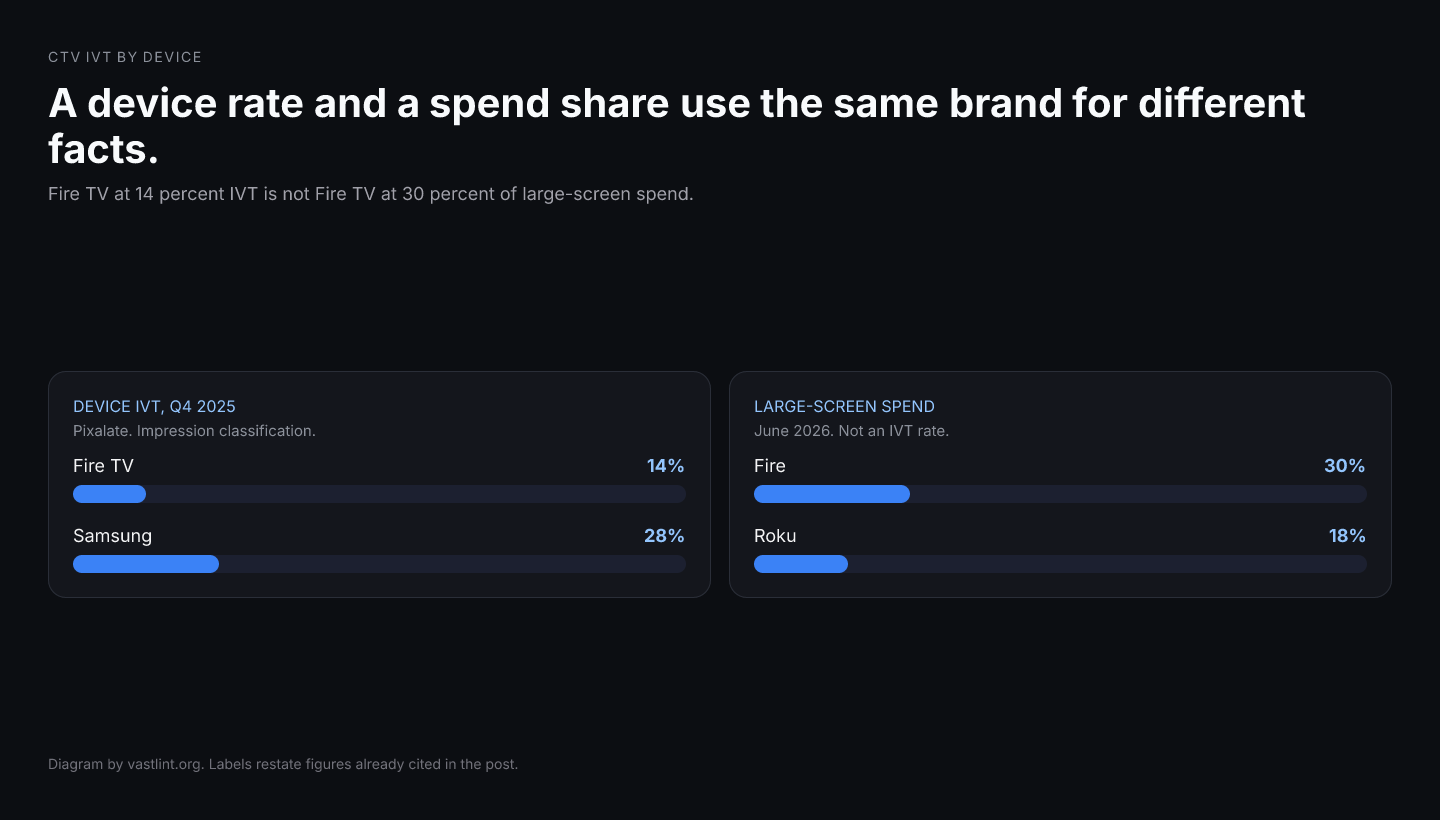
CTV IVT by device is the search that starts from a television brand. People also type Samsung Smart TV ad fraud, Fire TV invalid traffic, Roku ad fraud, and CTV fraud by region. The numbers that match those words are not one table. On March 26, 2026, Pixalate put Amazon Fire TV at 14 percent global device IVT and Samsung Smart TV at 28 percent, both inside Q4 2025 open-programmatic CTV. MediaPost, on August 5, 2026, reported a June 2026 Pixalate spend study: large screens are 57 percent of US open programmatic CTV spend, small screens 43 percent, and within the large-screen half Fire is 30 percent and Roku is 18 percent. DoubleVerify's May 7, 2026 release describes regions as a mix of violations: in North America, bot fraud was 82 percent of violations, and data-center traffic was 98 percent in APAC, 66 percent in EMEA, and 91 percent in LATAM.
Fourteen and twenty-eight are impression classifications on two device populations in one quarter. Thirty and eighteen are shares of spend. Eighty-two is a share of the violations a firm already flagged, not a share of impressions served in that region. Pasting Fire's spend weight next to Fire's IVT rate produces a sentence the studies did not publish: that the device which takes the most large-screen money is the device with the fraud problem. The IVT table says Samsung's rate is higher. The spend table says Fire's share of large-screen money is larger. Both can be true, and neither tells you Roku's invalid-traffic rate, because that row is not in the device IVT table.
vastlint does not classify a device as invalid. It checks whether a VAST 2.0–4.4 tag can actually play on the stacks in the spend map, including MediaFiles a television will select. A tag that only survives a phone will not explain a Fire TV IVT row.
What the device IVT rows measure
The March 26 note is a supply-chain cut of open programmatic CTV. Global open programmatic CTV invalid traffic is 21 percent on more than 7 billion transactions, which is a different base from the March 9 benchmark of more than 103 billion impressions across web, app, and CTV. Inside that supply-chain note, the device changes the rate without changing the firm or the quarter. Fire TV at 14 percent and Samsung Smart TV at 28 percent differ by fourteen points because the population changed. A national US CTV figure of 19 percent, from the March 9 release, is a third population again: predominantly buy-side open auction, United States, not one operating system.
Someone managing a Samsung-heavy buy who uses 19 percent as the target is using the country. Someone using 14 percent is using Fire TV. The gap is the device mix, which is also why a campaign that shifts from one OEM to another can move its IVT line without any vendor changing a model. The shortlist habit is to treat that move as a change in fraud. It can be a change in which rows of this table the campaign sits on.
What the spend shares measure, including Roku
The June 2026 study, as MediaPost reported it, is where the money went. Fifty-seven percent of US open programmatic CTV spend on large screens, 43 percent on phones and tablets. Fire at 30 percent and Roku at 18 percent of the large-screen portion. Genre and daypart skew with the surface, which matters for which MediaFile the player will pick. None of those sentences is an invalid-traffic rate. Roku ad fraud, as a query, does not get an answer from 18 percent. Eighteen percent is Roku's share of large-screen open spend in that study. A Roku IVT rate would be a classification of Roku impressions, and this note does not have one.
Fire is the brand that shows up in both files, which is the trap. Fourteen percent IVT and 30 percent of large-screen spend are both about Fire TV and they do not multiply into a fraud-weighted spend figure unless you compute one yourself and label it as yours. Pixalate did not publish that product in the sentences cited here. A buyer who weights the 14 percent by the 30 percent has built a new number. It should not be cited back as Pixalate's Fire TV fraud share of the market.
Why a regional mix is a third unit
DoubleVerify's regional lines are easy to read as CTV fraud by country. North America, 82 percent bot fraud. APAC, 98 percent data-center. Those are compositions of violations, the character of what was flagged, not the percent of impressions in the region that were invalid. A region can have a low impression IVT rate and still have almost all of its violations be data-center traffic. A region can have a high impression rate made mostly of bots. The fix for data-center traffic is closer to the general-invalid list. The fix for bots that imitate users is the sophisticated investigation. Averaging 82 and 98 produces neither an impression rate nor a plan.
Put the device IVT row, the spend share, and the violation mix in different columns before any of them is called the CTV rate. The 19 percent US figure remains the open-auction country rate. It is not the Samsung rate, the Fire spend share, or the North American violation mix.
Device and region sentences that use different units
- Pixalate, Q4 2025, open-programmatic CTV, March 26, 2026: Fire TV 14 percent global device IVT, Samsung Smart TV 28 percent.
- Pixalate, March 9, 2026: US CTV 19 percent, a country rate, not a device rate.
- Pixalate, June 2026 spend study, as MediaPost reported it: large screens 57 percent of US open programmatic CTV spend, Fire 30 percent and Roku 18 percent of the large-screen half. Spend, not IVT.
- Roku's 18 percent does not say what share of Roku impressions were invalid.
- DoubleVerify, May 7, 2026: 82 percent of North American violations were bot fraud, and 98 percent of APAC violations were data-center traffic. That is the mix of what was flagged.
A television brand can have a high IVT rate, a large share of spend, or both, and those are two measurements even when the logo on the bezel is the same.
Check the tag against the stacks in the spend map
Run VAST 2.0–4.4 tags against specification-derived rules so MediaFiles and verification nodes are present for the players you actually buy. Nothing is stored. This does not produce a device IVT rate.
Sources
March 26, 2026. Fire TV at 14 percent and Samsung Smart TV at 28 percent.
MediaPost, August 5, 2026, on Pixalate's June 2026 spend split, including Fire and Roku shares of large-screen spend.
What the spend split means for the tag, separate from the IVT rows.
Why 19 percent, 14 percent, and 28 percent are not one normal.