I just shipped VASTlint 0.14.0, one of the biggest upgrades in a while. What I want from this release is simple: a full VAST check returned while an ad decision is still open.
If you're building an ad server, a finding is useful when there's still time to choose another eligible bid. An SSAI service has a similar decision before it commits to stitching a response. In either case, the check needs to fit alongside the rest of the request.
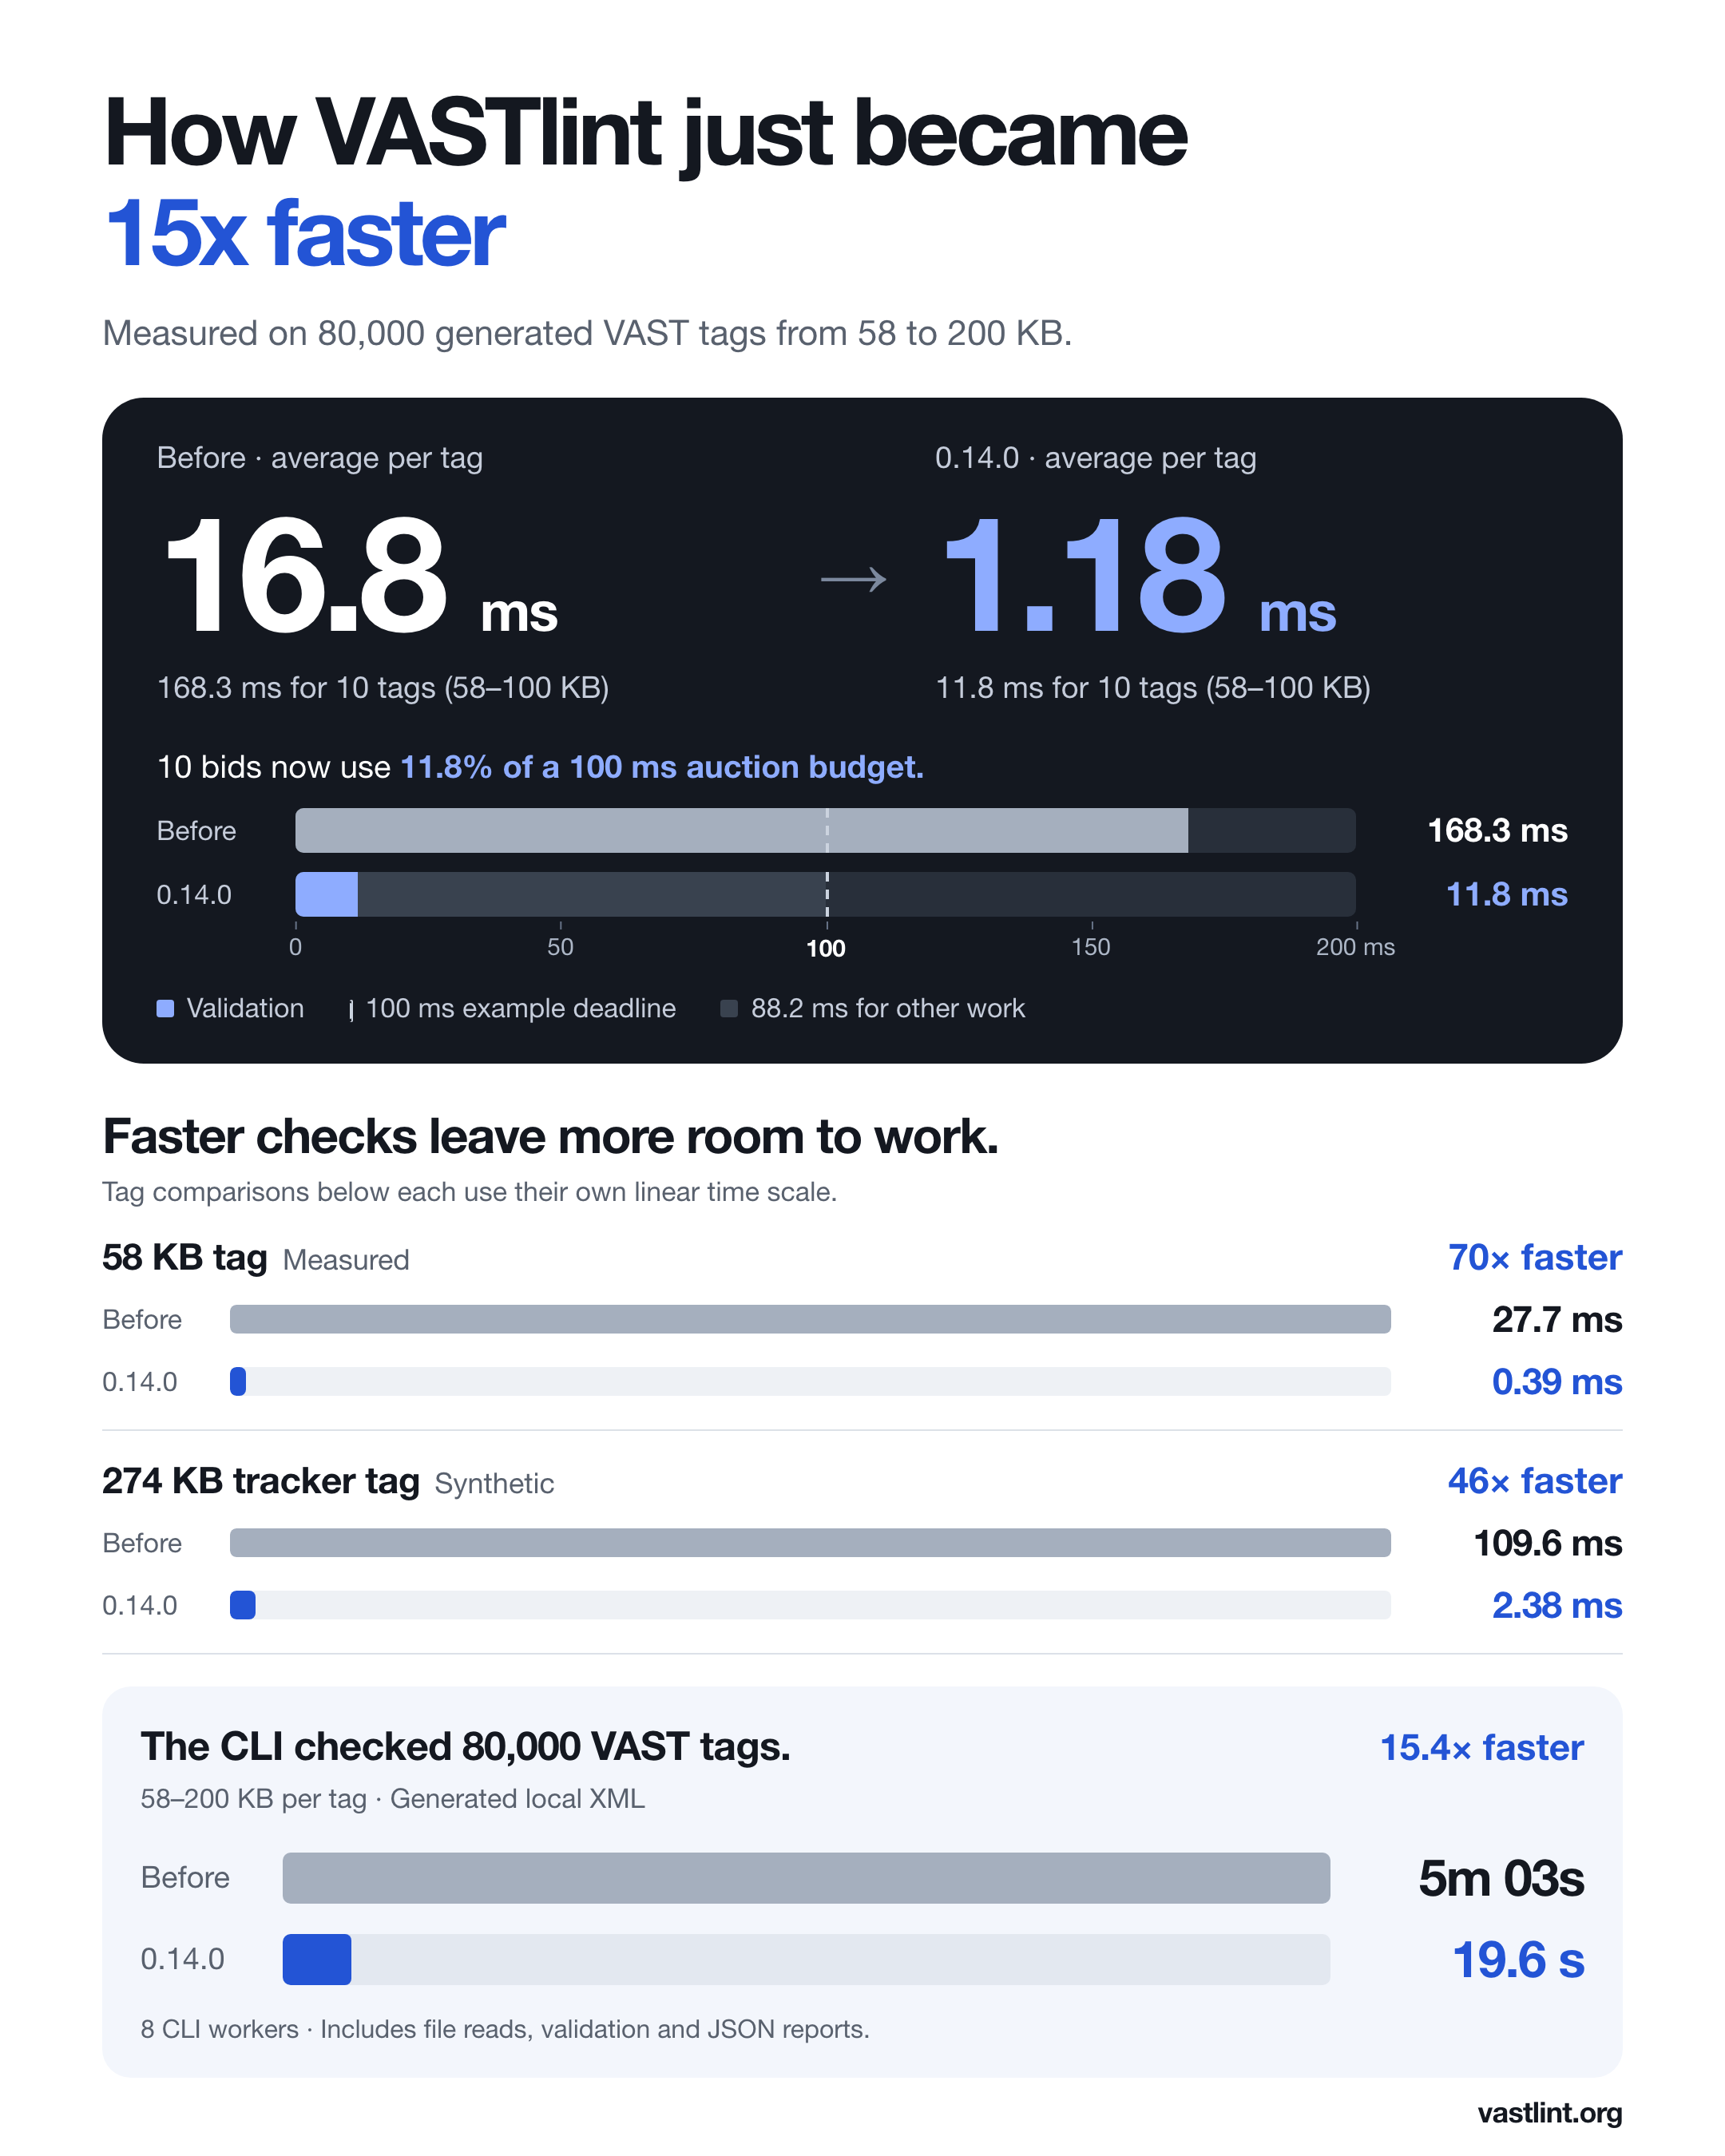
The 15× headline comes from my CLI benchmark of 80,000 generated tags between 58 KB and 200 KB. The whole batch went from 5 minutes 3 seconds to 19.6 seconds, a 15.4× improvement, with eight workers on both builds. That result includes file reads and JSON reports.
What interests me most is how the same parser change affects the much smaller window available during an auction.
Validation needs to leave time for the rest of the auction.
Imagine an auction with 10 available VAST bid responses and a 100 ms deadline. I benchmarked a mix of 10 generated tags from 58 KB to 100 KB, split evenly between ad pods and tags with many trackers.
Checking the full mix serially went from 168.3 ms to 11.8 ms, about 14 times faster. Dividing those median batch times by ten gives an average of 16.8 ms before and 1.18 ms after per tag for this mix.
The old checks alone would have exceeded that illustrative deadline. The new checks take 11.8% of the window, leaving 88.2 ms for the rest of the request. That's the balance I'm looking for: enough room to examine the responses we're deciding between and still finish the decision on time.
These are native, in-memory validation timings on Apple M4. The auction is a budgeting example. Fetching responses, following wrappers and crossing a service boundary still need their own time. The generated mix gives me a controlled comparison of denser tags; it isn't a representative production auction.
Earlier findings give the team a chance to act.
For a team running an auction, the opportunity is to check each available VAST response before accepting it. If a finding meets your policy for blocking a response, the decision code can exclude that response while another eligible bid is still available.
The same finding can also explain the rejection. VASTlint returns a rule and a location, so the engineer receiving that feedback has something specific to investigate. Faster validation makes it easier to consider providing that feedback as part of the request workflow.
For SSAI, the opportunity is a check before committing to a response. For someone investigating a tag interactively, it's a shorter wait between making a change and checking it again.
Those workflows still need an integration and a policy for acting on findings. This release lowers the cost of the check that supplies the information.
A slow tag can use a large part of the window.
In an auction with a deadline, I care about the tag that takes much longer than the ones around it.
One measured 58 KB tag went from 27.7 ms to 0.39 ms, about 70 times faster, with the same findings and locations. In the 100 ms example, that one old check would have used more than a quarter of the window.
Across the earlier measured set, the 99th percentile fell from 3.37 ms to 0.81 ms. The new maximum was 1.34 ms. Reducing that tail matters when a response arrives late and there is less time left to make the decision.
The CLI can check a whole library of larger tags in seconds.
I also wanted to measure a complete CLI workflow. A team checking a creative library before a rollout needs the files read and the reports returned, as well as the XML validated.
I fixed five size profiles before timing: 58, 80, 120, 160 and 200 KB, with 16,000 generated files at each size. Every file contains one creative, with different numbers of tracking elements across the profiles. Together, the 80,000 tags contain 9.9 GB of XML.
With eight CLI workers on each build, the complete check went from 5 minutes 3 seconds to 19.6 seconds. That's the 15.4× aggregate gain rounded to 15× in the headline. Both builds had the same concurrency, compiler, runtime dependencies and allocator. Only the parser differs in their runtime source.
The full batch time includes process launches, local file reads, validation, JSON reports and verification of every returned report. It gives me a useful measure of how long a library check takes to finish.
These are generated larger tags, rather than observed production samples. All are valid and produce no findings. A library with extensive issue output may take longer. The complete JSON output matched between builds for all 80 corresponding CLI invocations.
The parser was rescanning XML to locate each element.
I traced the repeated parser work to byte_offset_to_line_col, the helper that converts an XML byte offset into a line and column number.
The XML reader already knows where an element begins as a byte offset. To turn that into a useful location for a finding, the parser needs to count the preceding newlines and work out how far the element is from the start of its line. It attaches that location to each element as it builds the document, including self-closing elements. That work happens even when the tag passes every validation rule.
The old helper started at byte zero each time. For the next element, it counted through the same beginning of the document again, then continued to the new position. The reader was moving forward, but the location helper kept starting over.
For a simple example, imagine four elements starting at 10, 20, 30 and 40 KB. The helper scans 10 KB for the first location, 20 KB for the second, then 30 KB and 40 KB. That's 100 KB of location scanning to reach a position only 40 KB into the XML. Those are illustrative byte counts, not benchmark timings.
In a tag with thousands of tracking elements, the parser could count through the beginning of the document thousands of times. As a document grows while keeping roughly the same density of elements, that repeated location work can grow roughly with the square of its size.
This explains why byte size alone didn't predict the cost. One very long media URL adds bytes but few elements. An ad pod or a tag with many trackers creates far more calls to calculate a location.
The line cursor keeps its place in the XML.
I replaced that helper with a LineCursor, created once for each parsed document. It remembers the previous byte position, the current line number and the byte position where that line starts.
When the next opening or self-closing element arrives, the cursor scans only the bytes between its previous position and the new element. Each newline increments the line number and updates the start of the line. The column is then the element's byte offset minus the line's start, plus one.
For those same four positions, the cursor scans four successive 10 KB slices: 40 KB of location scanning in total, instead of 100 KB. The savings grow as more elements would otherwise make it revisit the same bytes.
Get VAST spec updates, platform guides, and release notes in your inbox.
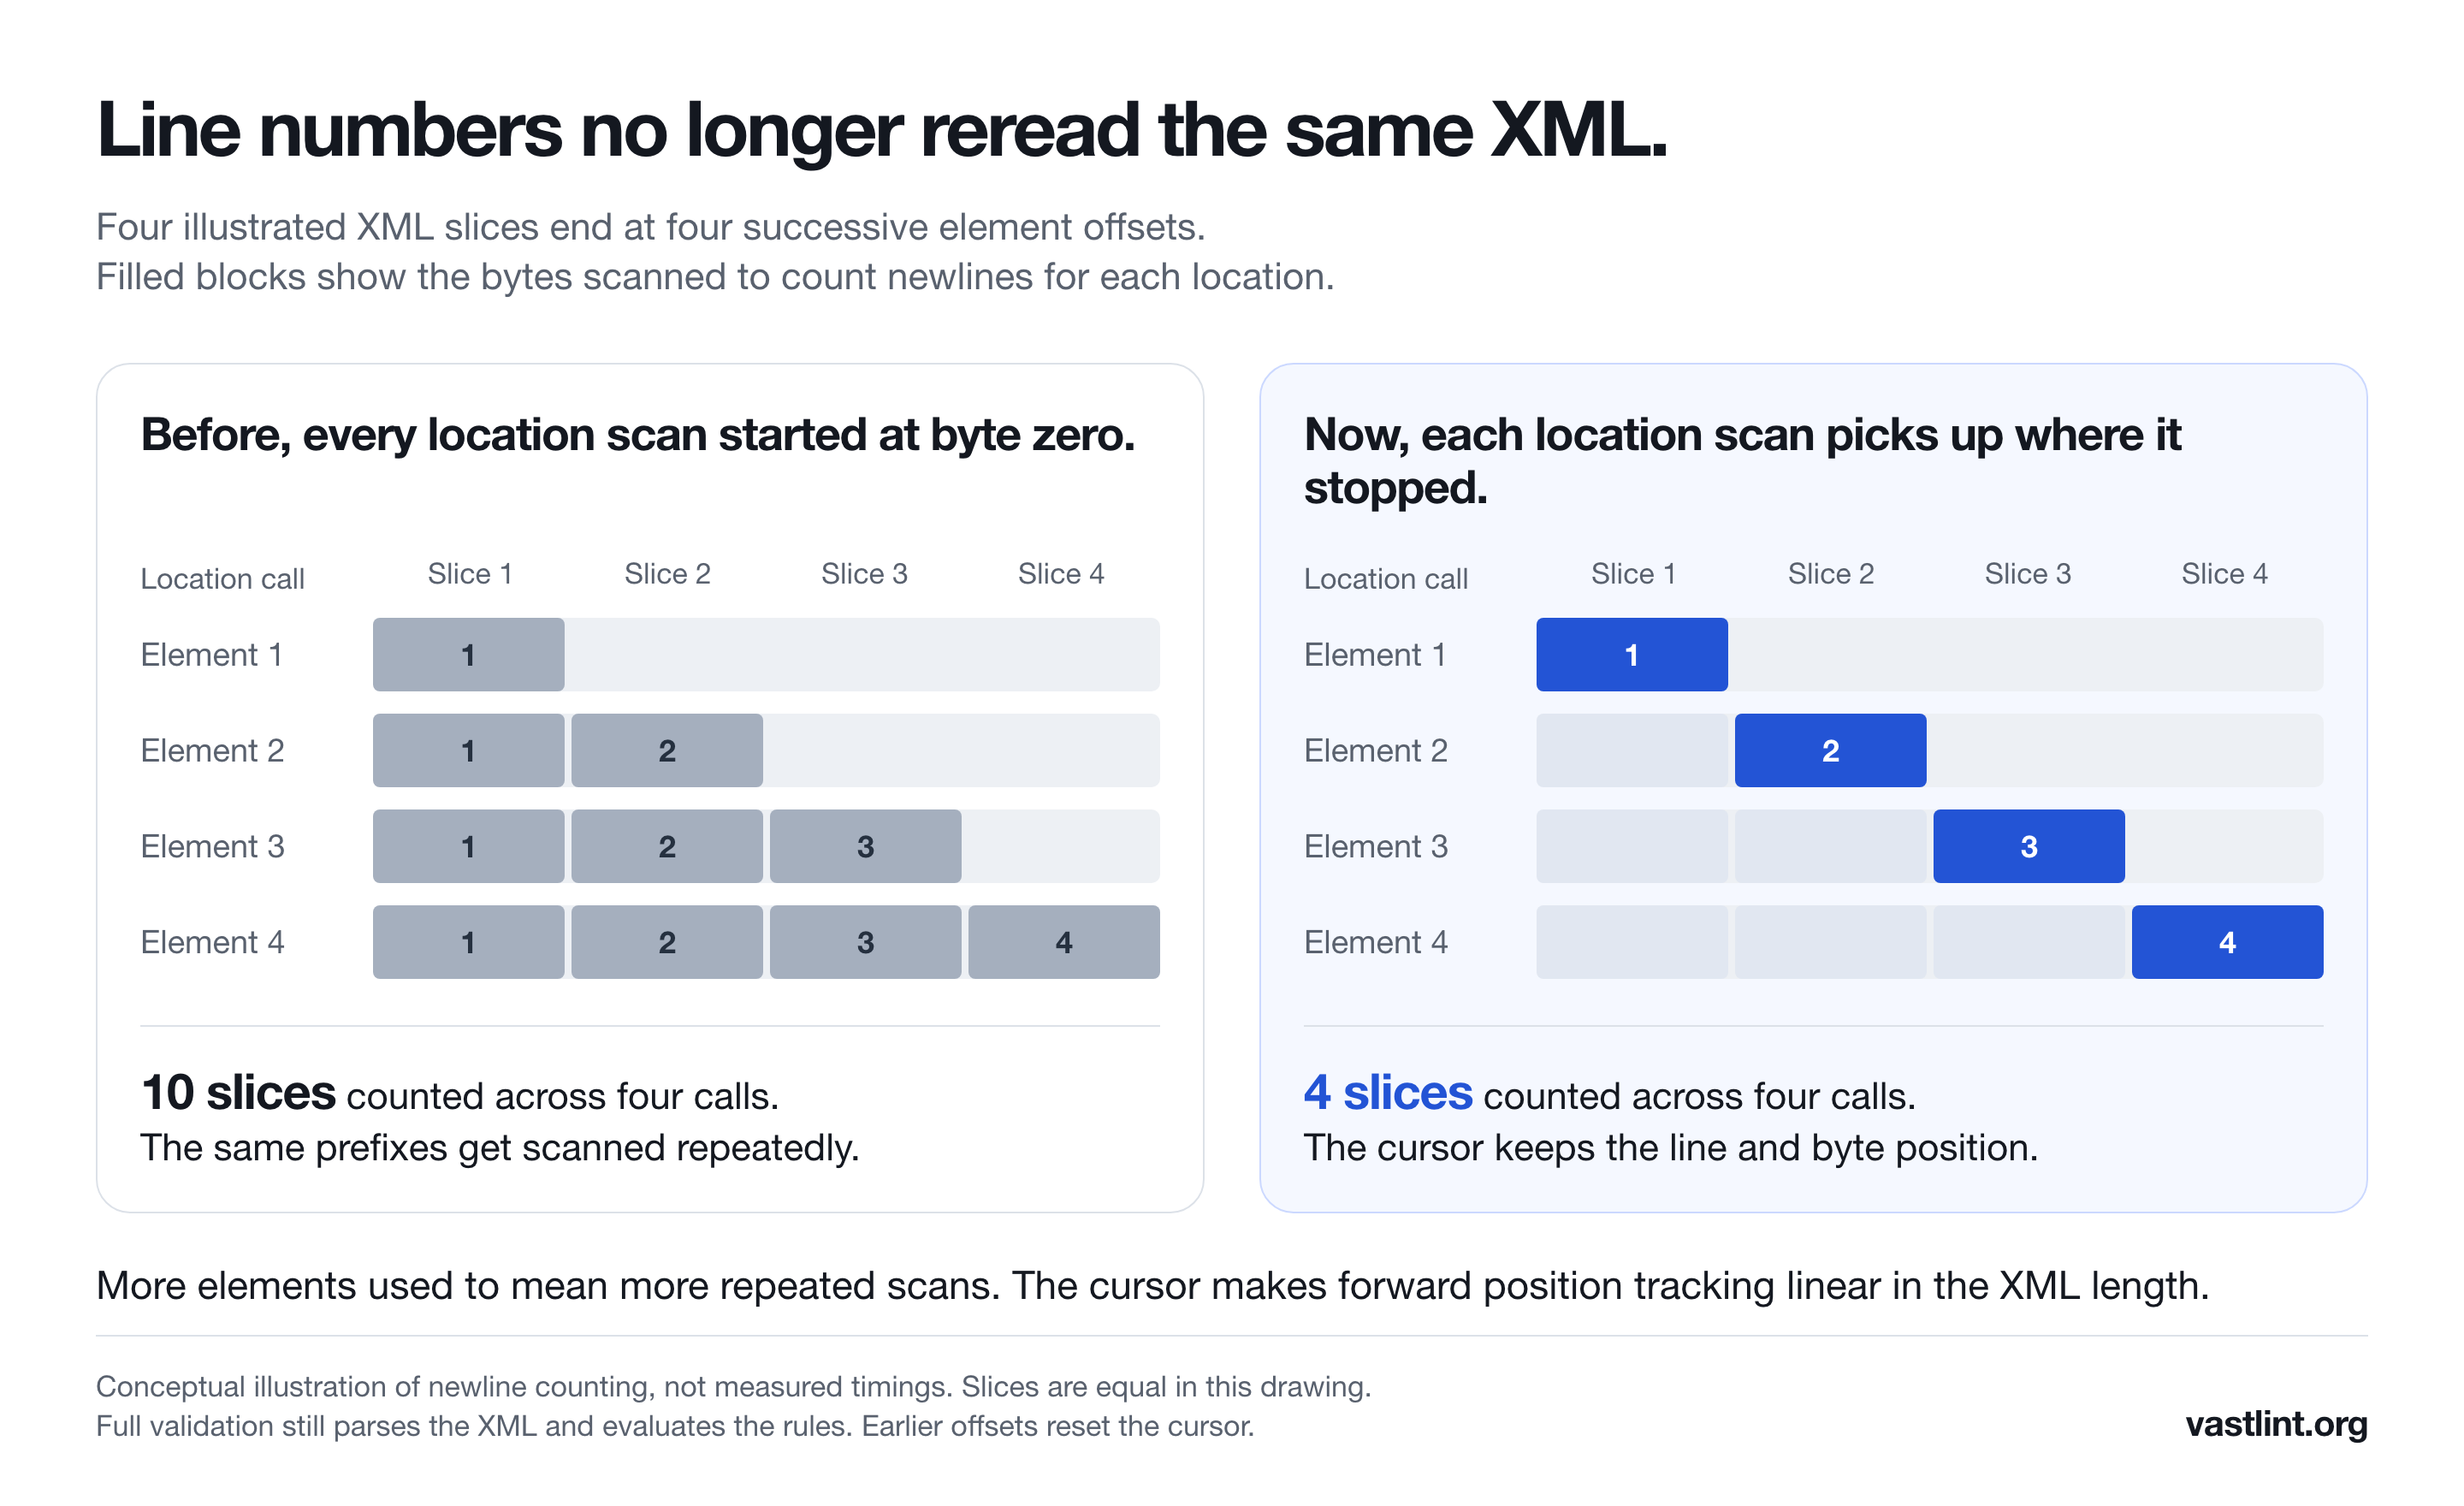
Elements arrive in document order, so the slices don't overlap. Location tracking becomes a single forward pass, covering each byte at most once. That describes the location work; XML parsing and the validation rules still have their own costs.
The cursor starts fresh for every document. If a caller asks for an earlier offset within a document, it resets and scans from the beginning. Line and column numbers remain 1-based, and columns still count bytes.
The parser still builds the document and the same validation rules run against it. Findings retain their source locations. Removing the repeated scans makes that full check cheaper, which is why the improvement also shows up in the CLI batch of valid tags with no findings to report.
I checked that the faster build returned the same findings.
Before shipping, I compared 150 XML fixtures and the stored tags used in the earlier benchmark. Rule ID, path, line, column and severity matched between builds. The stored tags produced the same 8,112 issues, and cargo test --all passed with the cursor in place.
The findings also matched on all ten generated documents in the auction example. For the larger CLI workload, the runner checked every returned filename, version, validity, issue list and summary, then compared complete report hashes between builds.
That matters because the point of the upgrade is to get the full check back sooner, with the information needed to act on it.
The ten-tag benchmark measures full native validation.
The ten-tag comparison measures full vastlint_core::validate calls in native release builds. Both copies use the same core source, with the baseline's parse.rs taken from 0.13.13. Each document was warmed three times, then I timed 21 complete serial batches per build, alternating which build ran first. The figures use the median batch time. Average time per tag is that median divided by ten.
The CLI benchmark measures the complete library check.
The CLI comparison uses one complete 80,000-file pass per build, baseline first. Eight workers run up to eight separate CLI processes concurrently, each invocation checking 1,000 files serially. There are 80 invocations per build and a five-file warmup covering the size profiles. The comparison uses full batch wall time; individual process timings overlap. Filesystem caching was warm or uncontrolled.
I measured both comparisons on 4 October 2026, on Apple M4 with rustc 1.97.1. Building the binaries, generating the dataset, remote fetching and wrapper resolution are outside the timings.
The earlier broader set averaged 6.9 KB of XML. Its mean per-document median fell from 0.340 ms to 0.113 ms, about 3.0× overall. Those measurements used rustc 1.91.1 and five calls per document. An early single pass had stalls that didn't repeat on retiming, so I excluded it and used the five-call medians for both builds. The 15× headline applies to the generated workload of larger tags.
Element density explains where the larger gains appear.
The synthetic stress tests help show the effect of repeated location work. A 274 KB tag with many trackers fell from 109.6 ms to 2.38 ms. A 2 MB ad pod fell from a median of 23.3 seconds to 81.4 ms over ten calls per build. A 10 MB pod went from 9.2 minutes to 361 ms, though that pair was one run per build and the old 2 MB timings varied substantially.
Those larger tests matched issue counts and hashes of rule ID, line, column and severity. The hashes omitted paths, so that check was narrower than the fixture and stored-tag comparisons.
A control padded with one huge media URL behaved differently. At 10 MB, it took about 20 ms before and 25 ms after. The 4, 6 and 8 MB controls were slightly slower too; an unexplained 2 MB control improved from 28.5 ms to 6.4 ms. This change addresses repeated scans in documents with many elements. The gains depend on the structure of the tag.
The benchmark summary, ten-tag comparison and 80,000-tag CLI comparison accompany the article. The generated fixtures, runners and timing records are available as a downloadable benchmark package. The stored XML and its per-document timings remain private, so the sampled percentiles can't be independently recomputed from the published files.
I want the result available while the decision is still open.
For engineers, this release makes it easier to evaluate a full VAST check inside the request path. For product teams, it creates room to offer earlier rejection with a specific explanation of what needs attention. The same improvement also shortens the wait for a large library check before a rollout.
Whether that leads to fewer failed impressions depends on the integration, the findings you act on and the alternatives available in the auction. I haven't measured that downstream outcome.
What I have measured is cheaper validation, with matching findings and a much smaller slow tail in the earlier set. VASTlint 0.14.0 is shipped. I want that speed to give the person or service making the ad decision enough time to use the answer.
The public artifacts let you inspect the measurements.
Generated fixtures, five larger-tag examples, runners, lockfiles and complete timing records. The archive README explains reproduction outside this workspace.
Use the result in your validation workflow.
Integrate validation into the ad decision path.
Inspect a tag and its findings in the browser.
Check a creative library before deployment.